
Incident handling (IH) has become an important part of an organization's defensive capability against cybercrime. While protective measures are constantly being implemented to prevent or lower the amount of security incidents, an incident handling capability is undeniably a necessity for any organization that cannot afford a compromise of its data confidentiality, integrity, or availability. Some organizations choose to implement this capability in-house, while others rely on third-party providers to support them, continuously or when needed. Before we dive into the world of security incidents, let's define some terms and establish a common understanding of them.
An event is an action occurring in a system or network. Examples of events are:
An incident is an event with a negative consequence. One example of an incident is a system crash. Another example is unauthorized access to sensitive data. Incidents can also occur due to natural disasters, power failures, etc.
There is no single definition for what an IT security incident is, and therefore it varies between organizations. We define an IT security incident as an event with a clear intent to cause harm that is performed against a computer system. Examples of incidents are:
Incident handling is a clearly defined set of procedures to manage and respond to security incidents in a computer or network environment.
It is important to note that incident handling is not limited to intrusion incidents alone.
Other types of incidents, such as those caused by malicious insiders, availability issues, and loss of intellectual property, also fall within the scope of incident handling. A comprehensive incident handling plan should address various types of incidents and provide appropriate measures to identify, contain, eradicate, and recover from them to restore normal business operations as quickly and efficiently as possible.
Bear in mind that it may not be immediately clear that an event is an incident, until an initial investigation is performed. With that being said, there are some suspicious events that should be treated as incidents unless proven otherwise.
IT security incidents frequently involve the compromise of personal and business data, and it is therefore crucial to respond quickly and effectively. In some incidents, the impact may be limited to a few devices, while in others a large part of the environment can be compromised. A great benefit of having an incident handling team (often referred to as an incident response team) handle events is that a trained workforce will respond systematically, and therefore appropriate actions will be taken. In fact, the objective of such teams is to minimize the theft of information or the disruption of services that the incident is causing. This is achieved by performing investigations and remediation steps, which we will discuss more in depth shortly. Overall, the decisions that are taken before, during, and after an incident will affect its impact.
Because different incidents will have different impacts on the organization, we need to understand the importance of prioritization. Incidents with greater severity will require immediate attention and resources to be allocated for them, while others rated lower may also require an initial investigation to understand whether it is in fact an IT security incident that we are dealing with.
The incident handling team is led by an incident manager. This role is often assigned to a SOC manager, CISO/CIO, or third-party (trusted) vendor, and this person usually has the ability to direct other business units as well. The incident manager must be able to obtain information or have the mandate to require any employee in the organization to perform an activity in a timely manner, if necessary. The incident manager is the single point of communication who tracks the activities taken during the investigation and their status of completion.
One of the most widely used resources on incident handling is NIST's Computer Security Incident Handling Guide. The document aims to assist organizations in mitigating the risks from computer security incidents by providing practical guidelines on responding to incidents effectively and efficiently.
Before we start talking about handling incidents, we need to understand the attack lifecycle (a.k.a. the cyber kill chain). This lifecycle describes how attacks manifest themselves. Understanding this lifecycle will provide us with valuable insights on how far in the network an attacker is and what they may have access to during the investigation phase of an incident.
The cyber kill chain consists of seven (7) different stages, as depicted in the image below:
The recon stage is the initial stage, and it involves the part where an attacker chooses their target. Additionally, the attacker then performs information gathering to become more familiar with the target and gathers as much useful data as possible, which can be used in not only this stage but also in other stages of this chain. Some attackers prefer to perform passive information gathering from web sources such as LinkedIn and Instagram but also from documentation on the target organization's web pages. Job ads and company partners often reveal information about the technology utilized in the target organization. They can provide extremely specific information about antivirus tools, operating systems, and networking technologies. Other attackers go a step further; they start 'poking' and actively scan external web applications and IP addresses that belong to the target organization.
In the weaponize stage, the malware to be used for initial access is developed and embedded into some type of exploit or deliverable payload. This malware is crafted to be extremely lightweight and undetectable by the antivirus and detection tools. It is likely that the attacker has gathered information to identify the present antivirus or EDR technology in the target organization. On a large scale, the sole purpose of this initial stage is to provide remote access to a compromised machine in the target environment, which also has the capability to persist through machine reboots and the ability to deploy additional tools and functionality on demand.
In the delivery stage, the exploit or payload is delivered to the victim(s). Traditional approaches are phishing emails that either contain a malicious attachment or a link to a web page. The web page can be twofold: either containing an exploit or hosting the malicious payload to avoid sending it through email scanning tools. In all fairness, the web page can also mimic a legit website used by the target organization in an attempt to trick the victim into entering their credentials and collect them. Some attackers call the victim on the phone with a social engineering pretext in an attempt to convince the victim to run the payload. The payload in these trust-gaining cases is hosted on an attacker-controlled web site that mimics a well-known web site to the victim (e.g., a copy of the target organization's website). It is extremely rare to deliver a payload that requires the victim to do more than double-click an executable file or a script (in Windows environments, this can be .bat, .cmd, .vbs, .js, .hta and other formats). Finally, there are cases where physical interaction is utilized to deliver the payload via USB tokens and similar storage tools, that are purposely left around.
The exploitation stage is the moment when an exploit or a delivered payload is triggered. During the exploitation stage of the cyber kill chain, the attacker typically attempts to execute code on the target system in order to gain access or control.
In the installation stage, the initial stager is executed and is running on the compromised machine. As already discussed, the installation stage can be carried out in various ways, depending on the attacker's goals and the nature of the compromise. Some common techniques used in the installation stage include:
In the command and control stage, the attacker establishes a remote access capability to the compromised machine. As discussed, it is not uncommon to use a modular initial stager that loads additional scripts 'on-the-fly'. However, advanced groups will utilize separate tools in order to ensure that multiple variants of their malware live in a compromised network, and if one of them gets discovered and contained, they still have the means to return to the environment.
The final stage of the chain is the action or objective of the attack. The objective of each attack can vary. Some adversaries may go after exfiltrating confidential data, while others may want to obtain the highest level of access possible within a network to deploy ransomware. Ransomware is a type of malware that will render all data stored on endpoint devices and servers unusable or inaccessible unless a ransom is paid within a limited timeframe (not recommended).
It is important to understand that adversaries won't operate in a linear manner (like the cyber kill chain shows). Some previous cyber kill chain stages will be repeated over and over again. If we take, for example, the installation stage of a successful compromise, the logical next step for an adversary going forward is to initiate the recon stage again to identify additional targets and find vulnerabilities to exploit, so that he moves deeper into the network and eventually achieves the attack's objective(s).
Our objective is to stop an attacker from progressing further up the kill chain, ideally in one of the earliest stages.
Now that we are familiar with the cyber kill chain and its stages, we can better predict/anticipate next steps in an attack and also suggest appropriate measures against them.
Just like the cyber kill chain, there are different stages, when responding to an incident, defined as the incident handling process. The incident handling process defines a capability for organizations to prepare, detect, and respond to malicious events. Note that this process is suited for responding to IT security events, but its stages do not correspond to the stages of the cyber kill chain in a one-to-one manner.
As defined by NIST, the incident handling process consists of the following four (4) distinct stages:
.png)
Incident handlers spend most of their time in the first two stages, preparation and detection & analysis. This is where we spend a lot of time improving ourselves and looking for the next malicious event. When a malicious event is detected, we then move on to the next stage and respond to the event (but there should always be resources operating on the first two stages, so that there is no disruption of preparation and detection capabilities). As you can see in the image, the process is not linear but cyclic. The main point to understand at this point is that as new evidence is discovered, the next steps may change as well. It is vital to ensure that you don't skip steps in the process and that you complete a step before moving onto the next one. For example, if you discover ten infected machines, you should certainly not proceed with containing just five of them and starting eradication while the remaining five stay in an infected state. Such an approach can be ineffective because, at the bare minimum, you are notifying an attacker that you have discovered them and that you are hunting them down, which, as you could imagine, can have unpredictable consequences.
So, incident handling has two main activities, which are investigating and recovering. The investigation aims to:
Following the investigation, the recovery activity involves creating and implementing a recovery plan. When the plan is implemented, the business should resume normal business operations, if the incident caused any disruptions.
When an incident is fully handled, a report is issued that details the cause and cost of the incident. Additionally, "lessons learned" activities are performed, among others, to understand what the organization should do to prevent incidents of similar type from occurring again.
Let us now walk you through all stages of the incident handling process.
In the preparation stage, we have two separate objectives. The first one is the establishment of incident handling capability within the organization. The second is the ability to protect against and prevent IT security incidents by implementing appropriate protective measures. Such measures include endpoint and server hardening, active directory tiering, multi-factor authentication, privileged access management, and so on and so forth. While protecting against incidents is not the responsibility of the incident handling team, this activity is fundamental to the overall success of that team.
During the preparation, we need to ensure that we have:
Some of the written policies and documentation should contain an up-to-date version of the following information:
Some of the non-severe cases may be handled relatively quickly and without too much friction within the organization or outside of it. Other cases may require law enforcement notification and external communication to customers and third-party vendors, especially in cases of legal concerns arising from the incident. For example, a data breach involving customer data has to be reported to law enforcement within a certain time threshold in accordance with GDPR. There may be many compliance requirements depending on the location and/or branches where the incident has occurred, so the best way to understand these is to discuss them with your legal and compliance teams on a per-incident basis (or proactively).
While having documentation in place is vital, it is also important to document the incident as you investigate. Therefore, during this stage you will also have to establish an effective reporting capability. Incidents can be extremely stressful, and it becomes easy to forget this part as the incident unfolds itself, especially when you are focused and going extremely fast in order to solve it as soon as possible. Try to remain calm, take notes, and ensure that these notes contain timestamps, the activity performed, the result of it, and who did it. Overall, you should seek answers to who, what, when, where, why and how.
Moving forward, we also need to ensure that we have the right tools to perform the job. These include, but are not limited to:
Many of the tools mentioned above will be part of what is known as a jump bag - always ready with the necessary tools to be picked up and leave immediately. Without this prepared bag, gathering all necessary tools on the fly may take days or weeks before you are ready to respond.
Finally, we want to stress the importance of having your documentation system completely independent from your organization's infrastructure and properly secured. Assume from the beginning that your entire domain is compromised and that all systems can become unavailable. In similar fashion, communications about an incident should be conducted through channels that are not part of the organization's systems; assume that adversaries have control over everything and can read communication channels such as email.
Another part of the preparation stage is to protect against incidents. While protection is not necessarily the responsibility of an incident handling team, any protection-related activities should be known to them to better understand the type and sophistication of an incident and know where to look for artifacts/evidence, that could aid the investigation.
Let us now look at some of the highly recommended protective measures, which have a high mitigation impact against the majority of threats.
DMARC is an email protection against phishing built on top of the already existing SPF and DKIM. The idea behind DMARC is to reject emails that 'pretend' to originate from your organization. Therefore, if an adversary is spoofing an email pretending to be an employee asking for an invoice to be paid, the system will reject the email before it reaches the intended recipient. DMARC is easy and inexpensive to implement, however, I cannot stress enough that thorough testing is mandatory; otherwise (and this is oftentimes the case), you risk blocking legitimate emails with no ability to recover them.
With email filtering rules, you may be able to take DMARC to the 'next' level and apply additional protection against emails failing DMARC from domains you do not own. This is possible because some email systems will perform a DMARC check and include a header stating whether DMARC passed or failed in the message headers. While this can be incredibly powerful to detect phishing emails from any domain, it requires extensive testing before it can be introduced in a production environment. High false-positives here are emails that are sent 'on behalf of' via some email sending service, since they tend to fail DMARC due to domain mismatch.
Endpoint devices (workstations, laptops, etc.) are the entry points for most of the attacks that we are facing on a daily basis. If we consider the fact that most threats will originate from the internet and will target users who are browsing websites, opening attachments, or running malicious executables, a percentage of this activity will occur from their corporate endpoints.
There are a few widely recognized endpoint hardening standards by now, with CIS and Microsoft baselines being the most popular, and these should really be the building blocks for your organization's hardening baselines. Some highly important actions (that actually work) to note and do something about are:
When it comes to hardening, Don't let perfect be the enemy of good.
Network segmentation is a powerful technique to avoid having a breach spread across the entire organization. Business-critical systems must be isolated, and connections should be allowed only as the business requires. Internal resources should really not be facing the Internet directly (unless placed in a DMZ).
Additionally, when speaking of network protection you should consider IDS/IPS systems. Their power really shines when SSL/TLS interception is performed so that they can identify malicious traffic based on content on the wire and not based on reputation of IP addresses, which is a traditional and very inefficient way of detecting malicious traffic.
Additionally, ensure that only organization-approved devices can get on the network. Solutions such as 802.1x can be utilized to reduce the risk of bring your own device (BYOD) or malicious devices connecting to the corporate network. If you are a cloud-only company using, for example, Azure/Azure AD, then you can achieve similar protection with Conditional Access policies that will allow access to organization resources only if you are connecting from a company-managed device.
At this point in time, stealing privileged user credentials is the most common escalation path in Active Directory environments. Additionally, a common mistake is that admin users either have a weak (but often complex) password or a shared password with their regular user account (which can be obtained via multiple attack vectors such as keylogging). For reference, a weak but complex password is "Password1!". It includes uppercase, lowercase, numerical, and special characters, but despite this, it's easily predictable and can be found in many password lists that adversaries employ in their attacks. It is recommended to teach employees to use pass phrases because they are harder to guess and difficult to brute force. An example of a password phrase that is easy to remember yet long and complex is "i LIK3 my coffeE warm". If one knows a second language, they can mix up words from multiple languages for additional protection.
Multi-factor authentication (MFA) is another identity-protecting solution that should be implemented at least for any type of administrative access to ALL applications and devices.
Perform continuous vulnerability scans of your environment and remediate at least the "high" and "critical" vulnerabilities that are discovered. While the scanning can be automated, the fixes usually require manual involvement. If you can't apply patches for some reason, definitely segment the systems that are vulnerable!
Training users to recognize suspicious behavior and report it when discovered is a big win for us. While it is unlikely to reach 100% success on this task, these trainings are known to significantly reduce the number of successful compromises. Periodic "surprise" testing should also be part of this training, including, for example, monthly phishing emails, dropped USB sticks in the office building, etc.
The best way to detect security misconfigurations or exposed critical vulnerabilities is by looking for them from the perspective of an attacker. Doing your own reviews (or hiring a third party if the skillset is missing from the organization) will ensure that when an endpoint device is compromised, the attacker will not have a one-step escalation possibility to high privileges on the network. The more additional tools and activity an attacker is generating, the higher the likelihood of you detecting them, so try to eliminate easy wins and low-hanging fruits as much as possible.
Active Directory has a few known and unique escalation paths/bugs. New ones are quite often discovered too. Active Directory security assessments are crucial for the security posture of the environment as a whole. Don't assume that your system administrators are aware of all discovered or published bugs, because in reality they probably aren't.
We need to train incident handlers and keep them engaged. There is no question about that, and the best place to do it is inside an organization's own environment. Purple team exercises are essentially security assessments by a red team that either continuously or eventually inform the blue team about their actions, findings, any visibility/security shortcomings, etc. Such exercises will help in identifying vulnerabilities in an organization while testing the blue team's defensive capability in terms of logging, monitoring, detection, and responsiveness. If a threat goes unnoticed, there is an opportunity to improve. For those that are detected, the blue team can test any playbooks and incident handling procedures to ensure they are robust and the expected result has been achieved.
At this point, we have created processes and procedures, and we have guidelines on how to act upon security incidents.
The detection & analysis phase involves all aspects of detecting an incident, such as utilizing sensors, logs, and trained personnel. It also includes information and knowledge sharing, as well as utilizing context-based threat intelligence. Segmentation of the architecture and having a clear understanding of and visibility within the network are also important factors.
Threats are introduced to the organization via an infinite amount of attack vectors, and their detection can come from sources such as:
It is highly recommended to create levels of detection by logically categorizing our network as follows.
When a security incident is detected, you should conduct some initial investigation and establish context before assembling the team and calling an organization-wide incident response. Think about how information is presented in the event of an administrative account connecting to an IP address at HH:MM:SS. Without knowing what system is on that IP address and which time zone the time refers to, we may easily jump to a wrong conclusion about what this event is about. To sum up, we should aim to collect as much information as possible at this stage about the following:
With that information at hand, we can make decisions based on the knowledge we have gathered. What does this mean? We would likely take different actions if we knew that the CEO's laptop was compromised as opposed to an intern's one.
With the initially gathered information, we can start building an incident timeline. This timeline will keep us organized throughout the event and provide an overall picture of what happened. The events in the timeline are time-sorted based on when they occurred. Note that during the investigative process later on, we will not necessarily uncover evidence in this time-sorted order. However, when we sort the evidence based on when it occurred, we will get context from the separate events that took place. The timeline can also shed some light on whether newly discovered evidence is part of the current incident. For example, imagine that what we thought was the initial payload of an attack was later discovered to be present on another device two weeks ago. We will encounter situations where the data we are looking at is extremely relevant and situations where the data is unrelated and we are looking in the wrong place. Overall, the timeline should contain the information described in the following columns:
Date |
Time of the event |
hostname |
event description |
data source |
|---|---|---|---|---|
Let's take one event and populate the example table from above. It will look as follows:
Date |
Time of the event |
hostname |
event description |
data source |
|---|---|---|---|---|
| 09/09/2021 | 13:31 CET | SQLServer01 | Hacker tool 'Mimikatz' was detected | Antivirus Software |
As you can infer, the timeline focuses primarily on attacker behavior, so activities that are recorded depict when the attack occurred, when a network connection was established to access a system, when files were downloaded, etc. It is important to ensure that you capture from where the activity was detected/discovered and the systems associated with it.
When handling a security incident, we should also try to answer the following questions to get an idea of the incident's severity and extent:
The last two can possibly indicate the level of sophistication of an adversary.
As you can imagine, high-impact incidents will be handled promptly, and incidents with a high number of impacted systems will have to be escalated.
Incidents are very confidential topics and as such, all of the information gathered should be kept on a need-to-know basis, unless applicable laws or a management decision instruct us otherwise. There are multiple reasons for this. The adversary may be, for example, an employee of the company, or if a breach has occurred, the communication to internal and external parties should be handled by the appointed person in accordance with the legal department.
When an investigation is launched, we will set some expectations and goals. These often include the type of incident that occurred, the sources of evidence that we have available, and a rough estimation of how much time the team needs for the investigation. Also, based on the incident, we will set expectations on whether we will be able to uncover the adversary or not. Of course, a lot of the above may change as the investigation evolves and new leads are discovered. It is important to keep everyone involved and the management informed about any advancements and expectations.
When an investigation is started, we aim to understand what and how it happened. To analyze the incident-related data properly and efficiently, the incident handling team members need deep technical knowledge and experience in the field. One may ask, "Why do we care about how an incident happened? Why don't we simply rebuild the impacted systems and basically forget it ever happened?".
If we don't know how an incident happened or what was impacted, then any remediative steps we take will not ensure that the attacker cannot repeat his actions to regain access. If we, on the other hand, know exactly how the adversary got in, what tools they used, and which systems were impacted, then we can plan our remediation to ensure that this attack path cannot be replicated.
The investigation starts based on the initially gathered (and limited) information that contain what we know about the incident so far. With this initial data, we will begin a 3-step cyclic process that will iterate over and over again as the investigation evolves. This process includes:

Let us now elaborate more on the process depicted above.
In order to reach a conclusion, an investigation should be based on valid leads that have been discovered not only during this initial phase but throughout the entire investigation process. The incident handling team should bring up new leads constantly and not go solely after a specific finding, such as a known malicious tool. Narrowing an investigation down to a specific activity often results in limited findings, premature conclusions, and an incomplete understanding of the overall impact.
An indicator of compromise is a sign that an incident has occurred. IOCs are documented in a structured manner, which represents the artifacts of the compromise. Examples of IOCs can be IP addresses, hash values of files, and file names. In fact, because IOCs are so important to an investigation, special languages such as OpenIOC have been developed to document them and share them in a standard manner. Another widely used standard for IOCs is Yara. There are a number of free tools that can be utilized, such as Mandiant's IOC Editor, to create or edit IOCs. Using these languages, we can describe and use the artifacts that we uncover during an incident investigation. We may even obtain IOCs from third parties if the adversary or the attack is known.
To leverage IOCs, we will have to deploy an IOC-obtaining/IOC-searching tool (native or third party and possibly at scale). A common approach is to utilize WMI or PowerShell for IOC-related operations in Windows environments. A word of caution! During an investigation, we have to be extra careful to prevent the credentials of our highly privileged user(s) from being cached when connecting to (potentially) compromised systems (or any systems, really). More specifically, we need to ensure that only connection protocols and tools that don't cache credentials upon a successful login are utilized (such as WinRM). Windows logons with logon type 3 (Network Logon) typically don't cache credentials on the remote systems. The best example of "know your tools" that comes to mind is "PsExec". When "PsExec" is used with explicit credentials, those credentials are cached on the remote machine. When "PsExec" is used without credentials through the session of the currently logged on user, the credentials are not cached on the remote machine. This is a great example of demonstrating how the same tool leaves different tracks, so be aware.
After searching for IOCs, you expect to have some hits that reveal other systems with the same signs of compromise. These hits may not be directly associated with the incident we are investigating. Our IOC could be, for example, too generic. We need to identify and eliminate false positives. We may also end up in a position where we come across a large number of hits. In this case, we should prioritize the ones we will focus on, ideally those that can provide us with new leads after a potential forensic analysis.
Once we have identified systems that included our IOCs, we will want to collect and preserve the state of those systems for further analysis in order to uncover new leads and/or answer investigative questions about the incident. Depending on the system, there are multiple approaches to how and what data to collect. Sometimes we want to perform a 'live response' on a system as it is running, while in other cases we may want to shut down a system and then perform any analysis on it. Live response is the most common approach, where we collect a predefined set of data that is usually rich in artifacts that may explain what happened to a system. Shutting down a system is not an easy decision when it comes to preserving valuable information because, in many cases, much of the artifacts will only live within the RAM memory of the machine, which will be lost if the machine is turned off. Regardless of the collection approach we choose, it is vital to ensure that minimal interaction with the system occurs to avoid altering any evidence or artifacts.
Once the data has been collected, it is time to analyze it. This is often the most time-consuming process during an incident. Malware analysis and disk forensics are the most common examination types. Any newly discovered and validated leads are added to the timeline, which is constantly updated. Also note that memory forensics is a capability that is becoming more and more popular and is extremely relevant when dealing with advanced attacks.
Keep in mind that during the data collection process, you should keep track of the chain of custody to ensure that the examined data is court-admissible if legal action is to be taken against an adversary.
When the investigation is complete and we have understood the type of incident and the impact on the business (based on all the leads gathered and the information assembled in the timeline), it is time to enter the containment stage to prevent the incident from causing more damage.
In this stage, we take action to prevent the spread of the incident. We divide the actions into short-term containment and long-term containment. It is important that containment actions are coordinated and executed across all systems simultaneously. Otherwise, we risk notifying attackers that we are after them, in which case they might change their techniques and tools in order to persist in the environment.
In short-term containment, the actions taken leave a minimal footprint on the systems on which they occur. Some of these actions can include, placing a system in a separate/isolated VLAN, pulling the network cable out of the system(s) or modifying the attacker's C2 DNS name to a system under our control or to a non-existing one. The actions here contain the damage and provide time to develop a more concrete remediation strategy. Additionally, since we keep the systems unaltered (as much as possible), we have the opportunity to take forensic images and preserve evidence if this wasn't already done during the investigation (this is also known as the backup substage of the containment stage). If a short-term containment action requires shutting down a system, we have to ensure that this is communicated to the business and appropriate permissions are granted.
In long-term containment actions, we focus on persistent actions and changes. These can include changing user passwords, applying firewall rules, inserting a host intrusion detection system, applying a system patch, and shutting down systems. While doing these activities, we should keep the business and the relevant stakeholders updated. Bear in mind that just because a system is now patched does not mean that the incident is over. Eradication, recovery, and post-incident activities are still pending.
Once the incident is contained, eradication is necessary to eliminate both the root cause of the incident and what is left of it to ensure that the adversary is out of the systems and network. Some of the activities in this stage include removing the detected malware from systems, rebuilding some systems, and restoring others from backup. During the eradication stage, we may extend the previously performed containment activities by applying additional patches, which were not immediately required. Additional system-hardening activities are often performed during the eradication stage (not only on the impacted system but across the network in some cases).
In the recovery stage, we bring systems back to normal operation. Of course, the business needs to verify that a system is in fact working as expected and that it contains all the necessary data. When everything is verified, these systems are brought into the production environment. All restored systems will be subject to heavy logging and monitoring after an incident, as compromised systems tend to be targets again if the adversary regains access to the environment in a short period of time. Typical suspicious events to monitor for are:
The recovery stage in some large incidents may take months, since it is often approached in phases. During the early phases, the focus is on increasing overall security to prevent future incidents through quick wins and the elimination of low-hanging fruits. The later phases focus on permanent, long-term changes to keep the organization as secure as possible.
In this stage, our objective is to document the incident and improve our capabilities based on lessons learned from it. This stage gives us an opportunity to reflect on the threat by understanding what occurred, what we did, and how our actions and activities worked out. This information is best gathered and analyzed in a meeting with all stakeholders that were involved during the incident. It generally takes place within a few days after the incident, when the incident report has been finalized.
The final report is a crucial part of the entire process. A complete report will contain answers to questions such as:
Such reports can eventually provide us with measurable results. For example, they can provide us with knowledge around how many incidents have been handled, how much time the team spends per incident, and the different actions that were performed during the handling process. Additionally, incident reports also provide a reference for handling future events of similar nature. In situations where legal action is to be taken, an incident report will also be used in court and as a source for identifying the costs and impact of incidents.
This stage is also a great place to train new team members by showing them how the incident was handled by more experienced colleagues. The team should also evaluate whether updating plans, playbooks, policies, and procedures is necessary. During the post-incident activity state, it is important that we reevaluate the tools, training, and readiness of the team, as well as the overall team structure, and not focus only on the documentation and process front.
We will explore the reporting part of the Incident Handling Process in more detail in the Security Incident Reporting module of the SOC Analyst job role path.
Crucial within the realm of computer protection, Security Information and Event Management (SIEM) encompasses the utilization of software offerings and solutions that merge the management of security data with the supervision of security events. These instruments facilitate real-time evaluations of alerts related to security, which are produced by network hardware and applications.
SIEM tools possess an extensive range of core functionalities, such as the collection and administration of log events, the capacity to examine log events and supplementary data from various sources, as well as operational features like incident handling, visual summaries, and documentation.
Employing SIEM innovations, IT personnel can detect cyberattacks at the time of or even prior to their occurrence, thereby enhancing the speed of their response during incident resolution. Consequently, SIEM plays an indispensable role in the effectiveness and ongoing supervision of a company's information security framework. It serves as the bedrock of an organization's security tactics, offering a holistic method for identifying and managing potential threats.
The acronym "SIEM" emerged from the collaboration of two Gartner analysts who suggested a novel security information framework that integrated two preceding technologies: Security Information Management (SIM) and Security Event Management (SEM). This proposition appeared in a 2005 Gartner paper titled "Enhance IT Security through Vulnerability Management."
First-generation SIM technology was developed upon conventional log collection management systems, allowing for extended storage, examination, and reporting of log data while incorporating logs with threat intelligence. Conversely, the second-generation SEM technology tackled security events by delivering consolidation, correlation, and notification of events from a range of security apparatuses, such as antivirus software, firewalls, Intrusion Detection Systems (IDS), in addition to events disclosed directly by authentication, SNMP traps, servers, and databases.
In the years that followed, vendors amalgamated the capabilities of SIM and SEM to devise the SIEM, leading to a fresh definition as per Gartner's investigation. This nascent technology gained widespread acceptance as it offered a comprehensive methodology for detecting and managing threats, including the ability to amass, preserve, and scrutinize logs and security events from various origins.
SIEM systems function by gathering data from a variety of sources, including PCs, network devices, servers, and more. This data is then standardized and consolidated to facilitate ease of analysis.
SIEM platforms employ security experts who scrutinize the data in order to identify and detect potential threats. This procedure allows businesses to locate security breaches and examine alerts, offering crucial insights into the organization's security standing.
Alerts notify Security Operations/Monitoring personnel that they must look into a (possible) security event or incident. These notifications are usually concise and inform staff of a specific attack targeting the organization's information systems. Alerts can be conveyed through multiple channels, such as emails, console pop-up messages, text messages, or phone calls to smartphones.
SIEM systems generate a vast number of alerts owing to the substantial volume of events produced for each monitored platform. It is not unusual for an hourly log of events to range from hundreds to thousands. As a result, fine-tuning the SIEM for detecting and alerting on high-risk events is crucial.
The capacity to accurately pinpoint high-risk events is what distinguishes SIEM from other network monitoring and detection tools, such as Intrusion Prevention Systems (IPS) or Intrusion Detection Systems (IDS). SIEM does not supplant the logging capabilities of these devices; rather, it operates in conjunction with them by processing and amalgamating their log data to recognize events that could potentially lead to system exploitation. By integrating data from numerous sources, SIEM solutions deliver a holistic strategy for threat detection and management.
Log Aggregation & Normalization
The importance of threat visibility through log consolidation offered by SIEM systems cannot be overstated. In its absence, an organization's cybersecurity holds as much value as a mere paperweight. Log consolidation entails gathering terabytes of security information from vital firewalls, confidential databases, and essential applications. This process empowers the SOC team to examine the data and discern connections, significantly improving threat visibility.
Utilizing SIEM log consolidation, the SOC team can identify and scrutinize security incidents and events throughout the organization's IT infrastructure. By centralizing and correlating information from various sources, SIEM delivers a holistic strategy for threat detection and handling. This approach allows organizations to recognize patterns, tendencies, and irregularities that could suggest potential security hazards. Consequently, SOC teams can react promptly and efficiently to security incidents, reducing the repercussions on the organization.
Threat Alerting
Having a SIEM solution that can identify and notify IT security teams about possible threats within the vast volume of collected security event data is essential. This feature is critical as it allows the IT security team to carry out swifter, more targeted investigations and respond to potential security incidents in a timely and efficient manner.
Advanced analytics and threat intelligence are employed by SIEM solutions to recognize potential threats and generate real-time alerts. When a threat is detected, the system forwards alerts to the IT security team, equipping them with the necessary details to effectively investigate and mitigate the risk. By alerting IT security teams promptly, SIEM solutions aid in minimizing the potential impact of security incidents and safeguarding the organization's vital assets.
Contextualization & Response
It is important to understand that merely generating alerts is not enough. If a SIEM solution sends alerts for every possible security event, the IT security team will soon be overwhelmed by the sheer volume of alerts, and false positives may become a frequent issue, particularly in older solutions. As a result, threat contextualization is crucial for sorting through alerts, determining the actors involved in the security event, the affected parts of the network, and the timing.
Contextualization enables IT security teams to identify genuine potential threats and act swiftly. Automated configuration processes can filter some contextualized threats, reducing the number of alerts received by the team.
An ideal SIEM solution should allow an enterprise to directly manage threats, often by stopping operations while investigations take place. This approach helps to minimize the potential impact of security incidents and protect the organization's critical assets. SIEM solutions provide context and automate threat filtering, allowing IT security teams to concentrate on genuine threats, reducing alert fatigue, and enhancing the efficiency and effectiveness of incident response.
Compliance
SIEM solutions play a significant role in compliance by assisting organizations in meeting regulatory requirements through a comprehensive approach to threat detection and management.
Regulations like PCI DSS, HIPAA, and GDPR mandate organizations to implement robust security measures, including real-time monitoring and analysis of network traffic. SIEM solutions can help organizations fulfill these requirements, enabling SOC teams to detect and respond to security incidents promptly.
Automated reporting and auditing capabilities are also provided by SIEM solutions, which are essential for compliance. These features allow organizations to produce compliance reports swiftly and accurately, ensuring that they satisfy regulatory requirements and can demonstrate compliance to auditors and regulators.
Let us now briefly see how data travel within a SIEM, until they are ready for analysis.
It is evident that the advantages of deploying a Security Information and Event Management (SIEM) system significantly outweigh the potential risks associated with not having one, assuming that the security control is safeguarding something of higher importance.
In the absence of a SIEM, IT personnel would not have a centralized perspective on all logs and events, which could result in overlooking crucial events and accumulating a large number of events awaiting investigation. Conversely, a properly calibrated SIEM bolsters the incident response process, improving efficiency and offering a centralized dashboard for notifications based on predetermined categories and event thresholds.
For instance, if a firewall records five successive incorrect login attempts, resulting in the admin account being locked, a centralized logging system that correlates all logs is necessary for monitoring the situation. Similarly, a web filtering software that logs a computer connecting to a malicious website 100 times in an hour can be viewed and acted upon within a single interface using a SIEM.
Contemporary SIEMs often include built-in intelligence capable of detecting configurable threshold limits and events within specific timeframes, as well as providing summaries and customizable reports. More sophisticated SIEMs are now integrating AI to notify based on behavioral and pattern analysis.
The reporting and notification capabilities of a SIEM empower IT staff to swiftly react and respond to potential incidents, emphasizing its ability to identify malicious attacks before they occur. This intelligence can lower the expenses associated with a full-scale security breach, sparing organizations significant financial and reputational harm.
Numerous regulated organizations, such as those in Banking, Finance, Insurance, and Healthcare, are mandated to have a managed SIEM either on-premise or in the cloud. SIEM systems offer evidence that systems are being monitored and logged, reviewed, and adhere to log retention policies, fulfilling compliance standards like ISO and HIPAA.
The Elastic stack, created by Elastic, is an open-source collection of mainly three applications (Elasticsearch, Logstash, and Kibana) that work in harmony to offer users comprehensive search and visualization capabilities for real-time analysis and exploration of log file sources.

The high-level architecture of the Elastic stack can be enhanced in resource-intensive environments with the addition of Kafka, RabbitMQ, and Redis for buffering and resiliency, and nginx for security.

Let's delve into each component of the Elastic stack.
Elasticsearch is a distributed and JSON-based search engine, designed with RESTful APIs. As the core component of the Elastic stack, it handles indexing, storing, and querying. Elasticsearch empowers users to conduct sophisticated queries and perform analytics operations on the log file records processed by Logstash.
Logstash is responsible for collecting, transforming, and transporting log file records. Its strength lies in its ability to consolidate data from various sources and normalize them. Logstash operates in three main areas:
Process input: Logstash ingests log file records from remote locations, converting them into a format that machines can understand. It can receive records through different input methods, such as reading from a flat file, a TCP socket, or directly from syslog messages. After processing the input, Logstash proceeds to the next function.Transform and enrich log records: Logstash offers numerous ways to modify a log record's format and even content. Specifically, filter plugins can perform intermediary processing on an event, often based on a predefined condition. Once a log record is transformed, Logstash processes it further.Send log records to Elasticsearch: Logstash utilizes output plugins to transmit log records to Elasticsearch.Kibana serves as the visualization tool for Elasticsearch documents. Users can view the data stored in Elasticsearch and execute queries through Kibana. Additionally, Kibana simplifies the comprehension of query results using tables, charts, and custom dashboards.
Note: Beats is an additional component of the Elastic stack. These lightweight, single-purpose data shippers are designed to be installed on remote machines to forward logs and metrics to either Logstash or Elasticsearch directly. Beats simplify the process of collecting data from various sources and ensure that the Elastic Stack receives the necessary information for analysis and visualization.
Beats -> Logstash -> Elasticsearch -> Kibana

Beats -> Elasticsearch -> Kibana

The Elastic stack can be used as a Security Information and Event Management (SIEM) solution to collect, store, analyze, and visualize security-related data from various sources.
To implement the Elastic stack as a SIEM solution, security-related data from various sources such as firewalls, IDS/IPS, and endpoints should be ingested into the Elastic stack using Logstash. Elasticsearch should be configured to store and index the security data, and Kibana should be used to create custom dashboards and visualizations to provide insights into security-related events.
To detect security-related incidents, Elasticsearch can be used to perform searches and correlations on the collected security data.
As Security Operations Center (SOC) analysts, we are likely to extensively use Kibana as our primary interface when working with the Elastic stack. Therefore, it is essential to become proficient with its functionalities and features.

Kibana Query Language (KQL) is a powerful and user-friendly query language designed specifically for searching and analyzing data in Kibana. It simplifies the process of extracting insights from your indexed Elasticsearch data, offering a more intuitive approach than Elasticsearch's Query DSL. Let's explore the technical aspects and key components of the KQL language.
Basic Structure: KQL queries are composed of field:value pairs, with the field representing the data's attribute and the value representing the data you're searching for. For example:Introduction To The Elastic Stack
event.code:4625
The KQL query event.code:4625 filters data in Kibana to show events that have the Windows event code 4625. This Windows event code is associated with failed login attempts in a Windows operating system.
By using this query, SOC analysts can identify failed login attempts on Windows machines within the Elasticsearch index, and investigate the source of the attempts and potential security threats. This type of query can help identify brute force attacks, password guessing, and other suspicious activities related to login attempts on Windows systems.
By further refining the query with additional conditions, such as the source IP address, username, or time range, SOC analysts can gain more specific insights and effectively investigate potential security incidents.
Free Text Search: KQL supports free text search, allowing you to search for a specific term across multiple fields without specifying a field name. For instance:Introduction To The Elastic Stack
"svc-sql1"
This query returns records containing the string "svc-sql1" in any indexed field.
Logical Operators: KQL supports logical operators AND, OR, and NOT for constructing more complex queries. Parentheses can be used to group expressions and control the order of evaluation. For example:Introduction To The Elastic Stack
event.code:4625 AND winlog.event_data.SubStatus:0xC0000072
The KQL query event.code:4625 AND winlog.event_data.SubStatus:0xC0000072 filters data in Kibana to show events that have the Windows event code 4625 (failed login attempts) and the SubStatus value of 0xC0000072.
In Windows, the SubStatus value indicates the reason for a login failure. A SubStatus value of 0xC0000072 indicates that the account is currently disabled.
By using this query, SOC analysts can identify failed login attempts against disabled accounts. Such a behavior requires further investigation, as the disabled account's credentials may have been identified somehow by an attacker.
Comparison Operators: KQL supports various comparison operators such as :, :>, :>=, :<, :<=, and :!. These operators enable you to define precise conditions for matching field values. For instance:Introduction To The Elastic Stack
event.code:4625 AND winlog.event_data.SubStatus:0xC0000072 AND @timestamp >= "2023-03-03T00:00:00.000Z" AND @timestamp <= "2023-03-06T23:59:59.999Z"
By using this query, SOC analysts can identify failed login attempts against disabled accounts that took place between March 3rd 2023 and March 6th 2023
Wildcards and Regular Expressions: KQL supports wildcards and regular expressions to search for patterns in field values. For example:Introduction To The Elastic Stack
event.code:4625 AND user.name: admin*
The Kibana KQL query event.code:4625 AND user.name: admin* filters data in Kibana to show events that have the Windows event code 4625 (failed login attempts) and where the username starts with "admin", such as "admin", "administrator", "admin123", etc.
This query (if extended) can be useful in identifying potentially malicious login attempts targeted at administrator accounts.
"How can I identify the available fields and values?", you may ask. Let's see how we could have identified the available fields and values that we used in this section.
Example: Identify failed login attempts against disabled accounts that took place between March 3rd 2023 and March 6th 2023 KQL:
Introduction To The Elastic Stack
event.code:4625 AND winlog.event_data.SubStatus:0xC0000072 AND @timestamp >= "2023-03-03T00:00:00.000Z" AND @timestamp <= "2023-03-06T23:59:59.999Z"
Data and field identification approach 1: Leverage KQL's free text search
Using the Discover feature, we can effortlessly explore and sift through the available data, as well as gain insights into the architecture of the available fields, before we start constructing KQL queries.
"4625". In the returned records we notice event.code:4625, winlog.event_id:4625, and @timestampevent.code is related to the Elastic Common Schema (ECS)winlog.event_id is related to Winlogbeat@timestamp typically contains the time extracted from the original event and it is different from event.created 
"0xC0000072". By expanding the returned record we notice winlog.event_data.SubStatus that is related to Winlogbeat 
Data and field identification approach 2: Leverage Elastic's documentation
It could be a good idea to first familiarize ourselves with Elastic's comprehensive documentation before delving into the "Discover" feature. The documentation provides a wealth of information on the different types of fields we may encounter. Some good resources to start with are:
Elastic Common Schema (ECS) is a shared and extensible vocabulary for events and logs across the Elastic Stack, which ensures consistent field formats across different data sources. When it comes to Kibana Query Language (KQL) searches within the Elastic Stack, using ECS fields presents several key advantages:
Unified Data View: ECS enforces a structured and consistent approach to data, allowing for unified views across multiple data sources. For instance, data originating from Windows logs, network traffic, endpoint events, or cloud-based data sources can all be searched and correlated using the same field names.Improved Search Efficiency: By standardizing the field names across different data types, ECS simplifies the process of writing queries in KQL. This means that analysts can efficiently construct queries without needing to remember specific field names for each data source.Enhanced Correlation: ECS allows for easier correlation of events across different sources, which is pivotal in cybersecurity investigations. For example, you can correlate an IP address involved in a security incident with network traffic logs, firewall logs, and endpoint data to gain a more comprehensive understanding of the incident.Better Visualizations: Consistent field naming conventions improve the efficacy of visualizations in Kibana. As all data sources adhere to the same schema, creating dashboards and visualizations becomes easier and more intuitive. This can help in spotting trends, identifying anomalies, and visualizing security incidents.Interoperability with Elastic Solutions: Using ECS fields ensures full compatibility with advanced Elastic Stack features and solutions, such as Elastic Security, Elastic Observability, and Elastic Machine Learning. This allows for advanced threat hunting, anomaly detection, and performance monitoring.Future-proofing: As ECS is the foundational schema across the Elastic Stack, adopting ECS ensures future compatibility with enhancements and new features that are introduced into the Elastic ecosystem.A Security Operations Center (SOC) is an essential facility that houses a team of information security experts responsible for continuously monitoring and evaluating an organization's security status. The main objective of a SOC team is to identify, examine, and address cybersecurity incidents by employing a mix of technology solutions and a comprehensive set of procedures.
The SOC team usually consists of proficient security analysts, engineers, and managers overseeing security operations. They collaborate closely with organizational incident response teams to guarantee security concerns are promptly detected and resolved.
Various technology solutions, such as Security Information and Event Management (SIEM) systems, Intrusion Detection and Prevention Systems (IDS/IPS), and Endpoint Detection and Response (EDR) tools, are utilized by the SOC team to monitor and identify security threats. They also make use of threat intelligence and engage in threat hunting initiatives to proactively detect potential threats and vulnerabilities.
Besides employing technology solutions, the SOC team follows a series of well-defined processes for addressing security incidents. These processes encompass incident triage, containment, elimination, and recovery. The SOC team cooperates closely with the incident response team to ensure proper handling of security incidents, safeguarding the organization's security stance.
In summary, a SOC is a vital element of an organization's cybersecurity approach. It offers continuous monitoring and response capabilities, enabling organizations to promptly detect and address security incidents, minimizing the consequences of a security breach and decreasing the likelihood of future attacks.
The primary function of the SOC team is to manage the ongoing operational aspect of enterprise information security rather than concentrating on the development of security strategies, designing security architecture, or implementing protective measures.
The SOC team mainly consists of security analysts who work collectively to detect, assess, respond to, report on, and prevent cybersecurity incidents.
Besides the primary responsibilities of a SOC team, some SOCs may possess advanced capabilities like forensic analysis and malware analysis. These abilities enable the SOC team to conduct in-depth investigations of security incidents and examine the root cause of the incident to avert future attacks.
As previously mentioned, the SOC team also collaborates closely with the incident response team to guarantee proper handling of security incidents and the preservation of the organization's security posture.
A SOC team consists of diverse roles responsible for handling the continuous, operational aspect of enterprise information security. These roles may encompass:
SOC Director: Responsible for overall management and strategic planning of the SOC, including budgeting, staffing, and alignment with organizational security objectives.SOC Manager: Oversees day-to-day operations, manages the team, coordinates incident response efforts, and ensures smooth collaboration with other departments.Tier 1 Analyst: Monitors security alerts and events, triages potential incidents, and escalates them to higher tiers for further investigation.Tier 2 Analyst: Performs in-depth analysis of escalated incidents, identifies patterns and trends, and develops mitigation strategies to address security threats.Tier 3 Analyst: Provides advanced expertise in handling complex security incidents, conducts threat hunting activities, and collaborates with other teams to improve the organization's security posture.Detection Engineer: A Detection Engineer is responsible for developing, implementing, and maintaining detection rules and signatures for security monitoring tools, such as SIEM, IDS/IPS, and EDR solutions. They work closely with security analysts to identify gaps in detection coverage and continuously improve the organization's ability to detect and respond to threats.Incident Responder: Takes charge of active security incidents, carries out in-depth digital forensics and containment and remediation efforts, and collaborates with other teams to restore affected systems and prevent future occurrences.Threat Intelligence Analyst: Gathers, analyzes, and disseminates threat intelligence data to help SOC team members better understand the threat landscape and proactively defend against emerging risks.Security Engineer: Develops, deploys, and maintains security tools, technologies, and infrastructure, and provides technical expertise to the SOC team.Compliance and Governance Specialist: Ensures that the organization's security practices and processes adhere to relevant industry standards, regulations, and best practices, and assists with audit and reporting requirements.Security Awareness and Training Coordinator: Develops and implements security training and awareness programs to educate employees about cybersecurity best practices and promote a culture of security within the organization.It is important to note that the specific roles and responsibilities within each tier can vary depending on the organization's size, industry, and specific security requirements.
In general, the tiered structure can be described as follows:
Tier 1 Analysts: Also known as "first responders," these analysts monitor security events and alerts, perform initial triage, and escalate potential incidents to higher tiers for further investigation. Their main goal is to quickly identify and prioritize security incidents.Tier 2 Analysts: These analysts are more experienced and perform deeper analysis of escalated incidents. They identify patterns and trends, develop mitigation strategies, and sometimes assist in incident response efforts. They may also be responsible for tuning security monitoring tools to reduce false positives and improve detection capabilities.Tier 3 Analysts: Often considered the most experienced and knowledgeable analysts on the team, Tier 3 analysts handle the most complex and high-profile security incidents. They may also engage in proactive threat hunting, develop advanced detection and prevention strategies, and collaborate with other teams to improve the organization's overall security posture.Security Operations Centers (SOCs) have evolved significantly from their early days as Network Operation Centers focused primarily on network security. In the first generation, known as SOC 1.0, organizations invested in certain security layers such as security intelligence platforms or identity management systems. However, the lack of proper integration led to uncorrelated alerts and a buildup of tasks across multiple platforms. This stage was characterized by an emphasis on network and perimeter security, even as threats began exploiting other vectors. Surprisingly, some organizations continue to rely on this outdated approach, seemingly waiting for a major breach to occur.
The emergence of sophisticated threats, including multi-vector, persistent, and asynchronous attacks with concealed indicators of compromise, has spurred the transition to SOC 2.0. Malware, including mobile variants, and botnets serve as the primary delivery methods for these attacks. The longevity, evolving behavior, and growth of botnets over time have become focal points for threat intelligence. SOC 2.0 is built on intelligence, integrating security telemetry, threat intelligence, network flow analysis, and other anomaly detection techniques. Additionally, layer-7 analysis is employed at this stage to identify low and slow attacks and other hidden threats. A forward-looking approach to threat research and collaboration between SOCs, either within sectors or at the national level, is crucial for SOC 2.0's success. Emphasis is placed on complete situational awareness, pre-event preparedness through vulnerability management, configuration management, and dynamic risk management, as well as post-event analysis and learning through incident response and in-depth forensics. Refining security intelligence rules and deploying countermeasures are also vital in this stage.
The cognitive SOC, or next-generation SOC, seeks to address the remaining shortcomings of SOC 2.0. While SOC 2.0 has all the essential subsystems, it often lacks operational experience and effective collaboration between business and security teams to create rules that detect threats specific to business processes and systems. Moreover, many organizations still lack standardized incident response and recovery procedures.
Cognitive SOCs aim to resolve these issues by incorporating learning systems that compensate for experience gaps in security decision-making. While the success rate of this approach may not be perfect in every instance, it is expected to improve over time.
The MITRE ATT\&CK (Adversarial Tactics, Techniques, and Common Knowledge) framework serves as an extensive, regularly updated resource outlining the tactics, techniques, and procedures (TTPs) employed by cyber threat actors. This structured methodology assists cybersecurity experts in comprehending, identifying, and reacting to threats more proactively and knowledgeably.
The ATT\&CK framework comprises matrices tailored to various computing contexts, such as enterprise, mobile, or cloud systems. Each matrix links the tactics (the goals attackers aim to achieve) and techniques (the methods used to accomplish their objectives) to distinct TTPs. This linkage allows security teams to methodically examine and predict attacker activities.
The MITRE ATT\&CK framework not only serves as a comprehensive resource for understanding adversarial tactics, techniques, and procedures (TTPs), but it also plays a crucial role in several aspects of Security Operations. These include:
Detection and Response: The framework supports SOCs in devising detection and response plans based on recognized attacker TTPs, empowering security teams to pinpoint potential dangers and develop proactive countermeasures.Security Evaluation and Gap Analysis: Organizations can leverage the ATT\&CK framework to identify the strengths and weaknesses of their security posture, subsequently prioritizing security control investments to effectively defend against relevant threats.SOC Maturity Assessment: The ATT\&CK framework enables organizations to assess their Security Operations Center (SOC) maturity by measuring their ability to detect, respond to, and mitigate various TTPs. This assessment assists in identifying areas for improvement and prioritizing resources to strengthen the overall security posture.Threat Intelligence: The framework offers a unified language and format to describe adversarial actions, enabling organizations to bolster their threat intelligence and improve collaboration among internal teams or with external stakeholders.Cyber Threat Intelligence Enrichment: Leveraging the ATT\&CK framework can help organizations enrich their cyber threat intelligence by providing context on attacker TTPs, as well as insights into potential targets and indicators of compromise (IOCs). This enrichment allows for more informed decision-making and effective threat mitigation strategies.Behavioral Analytics Development: By mapping the TTPs outlined in the ATT\&CK framework to specific user and system behaviors, organizations can develop behavioral analytics models to identify anomalous activities indicative of potential threats. This approach enhances detection capabilities and helps security teams proactively mitigate risks.Red Teaming and Penetration Testing: The ATT\&CK framework presents a systematic way to replicate genuine attacker techniques during red teaming exercises and penetration tests, ultimately assessing an organization's defensive capabilities.Training and Education: The comprehensive and well-organized nature of the ATT\&CK framework makes it an exceptional resource for training and educating security professionals on the latest adversarial tactics and methods.In conclusion, the MITRE ATT\&CK framework is an indispensable asset for security operations, offering a shared language and structure for describing and understanding adversarial behavior. It is vital for enhancing various aspects of security operations, from threat intelligence and behavioral analytics to SOC maturity assessment and cyber threat intelligence enrichment.
Utilizing SIEM use cases is a fundamental aspect of crafting a robust cybersecurity strategy, as they enable the effective identification and detection of potential security incidents. Use cases are designed to illustrate specific situations where a product or service can be applied, and they can range from general scenarios, such as failed login attempts, to more complex ones like detecting a ransomware outbreak.

For instance, consider a situation where a user named Rob experiences 10 consecutive failed authentication attempts. These events could originate from the actual user who forgot their credentials or from a malicious actor trying to brute force their way into the account. In either case, these 10 events are sent to the SIEM system, which then correlates them into a single event and triggers an alert to the SOC team under the "brute force" use case category.
Based on the log data generated within the SIEM, the SOC team is then responsible for taking appropriate action. This example demonstrates just one of the many possible use cases that can be developed, ranging from straightforward to more intricate situations.
The following critical stages must be considered when developing any use cases:

Requirements: Comprehend the purpose or necessity of the use case, pinpointing the specific scenario for which an alert or notification is needed. Requirements can be proposed by customers, analysts, or employees. For instance, the goal might be to design a detection use case for a brute force attack that triggers an alert after 10 consecutive login failures within 4 minutes.Data Points: Identify all data points within the network where a user account can be used to log in. Gather information about the data sources that generate logs for unauthorized access attempts or login failures. For example, data might come from Windows machines, Linux machines, endpoints, servers, or applications. Ensure logs capture essential details like user, timestamp, source, destination, etc.Log Validation: Verify and validate the logs, ensuring they contain all crucial information such as user, timestamp, source, destination, machine name, and application name. Confirm all logs are received during various user authentication events for critical data points, including local, web-based, application, VPN, and OWA (Outlook) authentication.Design and Implementation: After identifying and verifying all logs with different data points and sources, begin designing the use case by defining the conditions under which an alert should be triggered. Consider three primary parameters: Condition, Aggregation, and Priority. For example, in a brute force attack use case, create an alert for 10 login failures in 4 minutes while considering aggregation to avoid false positives and setting alert priority based on the targeted user's privileges.Documentation: Standard Operating Procedures (SOP) detail the standard processes analysts must follow when working on alerts. This includes conditions, aggregations, priorities, and information about other teams to which analysts need to report activities. The SOP also contains the escalation matrix.Onboarding: Start with the development stage before moving the alert directly into the production environment. Identify and address any gaps to reduce false positives, then proceed to production.Periodic Update/Fine-tuning: Obtain regular feedback from analysts and maintain up-to-date correlation rules by whitelisting. Continually refine and optimize the use case to ensure its effectiveness and accuracy.Now, let's explore a practical example using the Elastic stack as a SIEM solution to help understand how to map each of the above points.
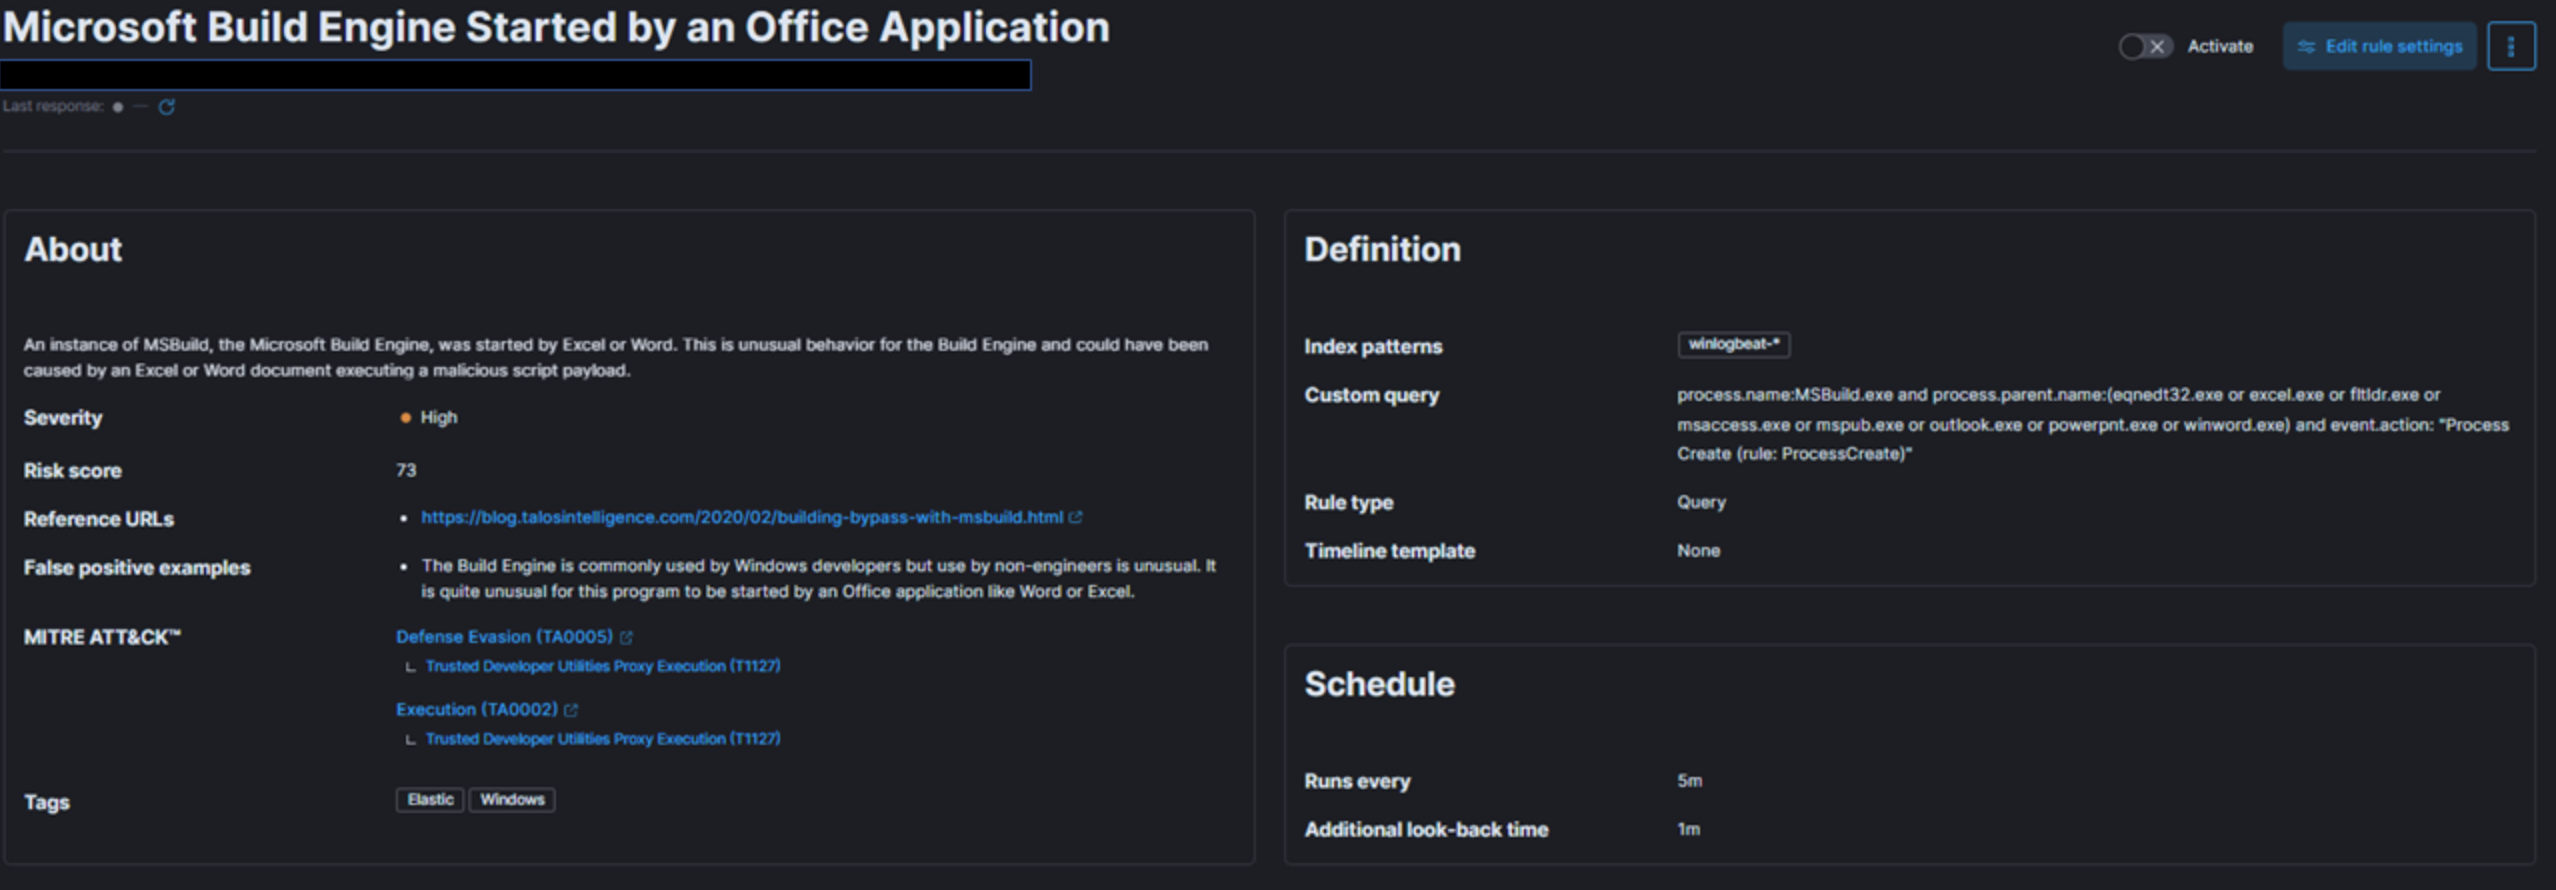
In the provided snapshot (detection use case), we need to determine our risk and the target of our monitoring efforts.
MSBuild, part of the Microsoft Build Engine, is a software build system that assembles applications according to its XML input file. Typically, Microsoft Visual Studio generates the input file, but the .NET framework and other compilers can also compile applications without it. Attackers exploit MSBuild's ability to include malicious source code within its configuration or project file.
When monitoring process execution command-line arguments, it is crucial to investigate instances where a web browser or Microsoft Office executable initiates MSBuild. This suspicious behavior suggests a potential breach. Once a baseline is established, unusual MSBuild calls should be easily identifiable and relatively rare, avoiding increased workload for the team.
To address this risk, we create a detection use case in our SIEM solution that monitors instances of MSBuild initiated by Excel or Word, as this behavior could indicate a malicious script payload execution.
Next, let's define priority, impact, and map the alert to the kill chain or MITRE framework.
Given the above risk and threat intelligence, this technique, known as Living-off-the-land binaries (LoLBins), poses a significant threat if detected, making it a high global risk category. Consequently, we assign it HIGH severity, though this may vary depending on your organization's specific context and landscape.
Regarding MITRE mapping, this use case involves bypassing detection techniques via LoLBins usage, falling under the Defense Evasion (TA0005) tactic, the Trusted Developer Utilities Proxy Execution (T1127) technique, and the Trusted Developer Utilities Proxy Execution: MSBuild (T1127.001) sub-technique. Additionally, executing the MSBuild binary on the endpoint also falls under the Execution (TA0002) tactic.
To define TTD and TTR, we need to focus on the rule's execution interval and the data ingestion pipeline discussed earlier. For this example, we set the rule to run every five minutes, monitoring all incoming logs.
When creating an SOP and documenting alert handling, consider the following:
The SOC team should document all the above points, along with the Incident Response Plan, so that Incident Handlers can reference them during analysis.
For rule fine-tuning, it is essential to understand the conditions that may trigger false positives. For example, while the Build Engine is common among Windows developers, its use by non-engineers is unusual. Excluding legitimate parent process names from the rule helps avoid false positives. Further details on fine-tuning SIEM rules will be given later on.
Example 1 discussed a high-severity detection use case and rule. Now, let's examine a medium-severity use case using a SIEM solution to better understand how each pointer contributes to the effectiveness of use cases.

In the given snapshot, we need to determine our risk and what we are trying to monitor.
Like in Example 1, we are again focusing on the MsBuild.exe binary. However, this time, we consider the scenario in which a machine attempts outbound communication with a remote or potentially malicious IP address, and the process behind that connection is MsBuild.exe. This would raise an alarm, as it may indicate adversarial activity. MsBuild is often exploited by adversaries to execute code and evade detection.
To address this risk, we need a monitoring solution capable of detecting instances where MsBuild is responsible for malicious outbound connections. We create a detection use case in our SIEM solution for this purpose.
Next, let's define priority, impact, and map the alert to the kill chain or MITRE framework.
Unlike the previous example, this situation could occur whenever MsBuild.exe establishes an outbound connection. It's also possible for this process to connect to a legitimate IP address, such as a Microsoft IP for updates. Therefore, we might encounter more false positives unless we implement a robust threat intelligence process. Consequently, we should assign this detection rule a MEDIUM severity instead of HIGH.
As in Example 1, pulling off this particular threat requires attackers to execute the MsBuild binary on the endpoint, which falls under the Execution (TA0002) tactic.
Most of the other pointers remain the same, but the SOP and Incident Response Plan will differ when handling this specific type of alert. Defenders will need to focus on event.action, IP address, and the reputation of the IP, among other factors.
Dashboards in SIEM solutions serve as containers for multiple visualizations, allowing us to organize and display data in a meaningful way.
In this and the following sections, we will create a dashboard and some visualizations from scratch.
Navigate to the bottom of this section and click on Click here to spawn the target system!
Now, navigate to http://[Target IP]:5601, click on the side navigation toggle, and click on "Dashboard".
Delete the existing "SOC-Alerts" dashboard as follows.

When visiting the Dashboard page again we will be presented with a message indicating that no dashboards currently exist. Additionally, there will be an option available to create a new Dashboard and its first visualization. To initiate the creation of our first dashboard, we simply have to click on the "Create new dashboard" button.

Now, to initiate the creation of our first visualization, we simply have to click on the "Create visualization" button.

Upon initiating the creation of our first visualization, the following new window will appear with various options and settings.
Before proceeding with any configuration, it is important for us to first click on the calendar icon to open the time picker. Then, we need to specify the date range as "last 15 years". Finally, we can click on the "Apply" button to apply the specified date range to the data.

There are four things for us to notice on this window:
A filter option that allows us to filter the data before creating a graph. For example, if our goal is to display failed logon attempts, we can use a filter to only consider event IDs that match 4625 – Failed logon attempt on a Windows system. The following image demonstrates how we can specify such a filter.

windows* in the "Index pattern".This search bar provides us with the ability to double-check the existence of a specific field within our data set, serving as another way to ensure that we are looking at the correct data. For example, let's say we are interested in the user.name.keyword field. We can use the search bar to quickly perform a search and verify if this field is present and discovered within our selected data set. This allows us to confirm that we are accessing the desired field and working with accurate data.

"Why user.name.keyword and not user.name?", you may ask. We should use the .keyword field when it comes to aggregations. Please refer to this stackoverflow question for a more elaborate answer.
Lastly, this drop-down menu enables us to select the type of visualization we want to create. The default option displayed in the earlier image is "Bar vertical stacked". If we click on that button, it will reveal additional available options (image redacted as not all options fit on the screen). From this expanded list, we can choose the desired visualization type that best suits our requirements and data presentation needs.

For this visualization, let's select the "Table" option. After selecting the "Table", we can proceed to click on the "Rows" option. This will allow us to choose the specific data elements that we want to include in the table view.

Let's configure the "Rows" settings as follows.

Note: You will notice Rank by Alphabetical and not Rank by Count of records like in the screenshot above. This is OK. By the time you perform the next configuration below, Count of records will become available.
Moving forward, let's close the "Rows" window and proceed to enter the "Metrics" configuration.

In the "Metrics" window, let's select "count" as the desired metric.

As soon as we select "Count" as the metric, we will observe that the table gets populated with data (assuming that there are events present in the selected data set)

One final addition to the table is to include another "Rows" setting to show the machine where the failed logon attempt occurred. To do this, we will select the host.hostname.keyword field, which represents the computer reporting the failed logon attempt. This will allow us to display the hostname or machine name alongside the count of failed logon attempts, as shown in the image.

Now we can see three columns in the table, which contain the following information:
Finally, click on "Save and return", and you will observe that the new visualization is added to the dashboard, appearing as shown in the following image.

Let's not forget to save the dashboard as well. We can do so by simply clicking on the "Save" button.

Suppose the SOC Manager suggested the following refinements:
Let's refine the visualization we created, so that it fulfills the suggestions above.
Navigate to http://[Target IP]:5601, click on the side navigation toggle, and click on "Dashboard".
The dashboard we previously created should be visible. Let's click on the "pencil"/edit icon.

Let's now click on the "gear" button at the upper-right corner of our visualization, and then click on "Edit lens".

"Top values of user.name.keyword" should be changed as follows.


"Top values of host.hostname.keyword" should be changed as follows.

The "Logon Type" can be added as follows (we will use the winlog.logon.type.keyword field).


"Count of records" should be changed as follows. 
We can introduce result sorting as follows. 
All we have to do now is click on "Save and return".
The DESKTOP-DPOESND, WIN-OK9BH1BCKSD, and WIN-RMMGJA7T9TC usernames can be excluded by specifying additional filters as follows.

Computer accounts can be excluded by specifying the following KQL query and clicking on the "Update" button.
SIEM Visualization Example 1: Failed Logon Attempts (All Users)
NOT user.name: *$ AND winlog.channel.keyword: Security
The AND winlog.channel.keyword: Security part is to ensure that no unrelated logs are accounted for.

This is our visualization after all the refinements we performed.

Finally, let's give our visualization a title by clicking on "No Title".

Don't forget to click on the "Save" button (the one on the upper-right hand side of the window).
In this SIEM visualization example we want to create visualization to monitor failed login attempts against disabled users.
We mention "failed" because it is not possible to log in with a disabled user, so it will never be successful even if the correct credentials are provided. In a scenario where the correct credentials are provided, the Windows logs will contain an additional SubStatus value of 0xC0000072, that indicates the reason of the failure.
Navigate to the bottom of this section and click on Click here to spawn the target system!.
Navigate to http://[Target IP]:5601, click on the side navigation toggle, and click on "Dashboard".
A prebaked dashboard should be visible. Let's click on the "pencil"/edit icon.
Now, to initiate the creation of our first visualization, we simply have to click on the "Create visualization" button.
Upon initiating the creation of our first visualization, the following new window will appear with various options and settings.
There are four things for us to notice on this window:
A filter option that allows us to filter the data before creating a graph. In this case our goal is to display failed logon attempts against disabled users only. We can use a filter to only consider event IDs that match 4625 – Failed logon attempt on a Windows system, like we did in the previous visualization example. In this case though, we should also take into account the SubStatus (winlog.event_data.SubStatus field) that indicates, when set to 0xC0000072, that the failure is due to a logon with disabled user. The following image demonstrates how we can specify such a filter.

windows* in the "Index pattern".This search bar provides us with the ability to double-check the existence of a specific field within our data set, serving as another way to ensure that we are looking at the correct data. Like in the previous visualization, we are interested in the user.name.keyword field. We can use the search bar to quickly perform a search and verify if this field is present and discovered within our selected data set. This allows us to confirm that we are accessing the desired field and working with accurate data.
Lastly, this drop-down menu enables us to select the type of visualization we want to create. The default option displayed in the earlier image is "Bar vertical stacked". If we click on that button, it will reveal additional available options (image redacted as not all options fit on the screen). From this expanded list, we can choose the desired visualization type that best suits our requirements and data presentation needs.
For this visualization, let's select the "Table" option. After selecting the "Table", we can proceed to click on the "Rows" option. This will allow us to choose the specific data elements that we want to include in the table view.
Let's configure the "Rows" settings as follows.
Moving forward, let's close the "Rows" window and proceed to enter the "Metrics" configuration.
In the "Metrics" window, let's select "count" as the desired metric.
One final addition to the table is to include another "Rows" setting to show the machine where the failed logon attempt occurred. To do this, we will select the host.hostname.keyword field, which represents the computer reporting the failed logon attempt. This will allow us to display the hostname or machine name alongside the count of failed logon attempts, as shown in the image.

Now we can see three columns in the table, which contain the following information:
Finally, click on "Save and return", and you will observe that the new visualization is added to the dashboard.
In this SIEM visualization example, we aim to create a visualization to monitor successful RDP logons specifically related to service accounts. Service account credentials are never used for RDP logons in corporate/real-world environments. We have been informed by the IT Operations department that all service accounts on the environment start with svc-.
The motivation for this visualization stems from the fact that service accounts often possess exceptionally high privileges. We need to keep a close eye on how service accounts are used.
Our visualization will be based on the following Windows event log.
Navigate to the bottom of this section and click on Click here to spawn the target system!.
Navigate to http://[Target IP]:5601, click on the side navigation toggle, and click on "Dashboard".
A prebaked dashboard should be visible. Let's click on the "pencil"/edit icon.
Now, to initiate the creation of our first visualization, we simply have to click on the "Create visualization" button.
Upon initiating the creation of our first visualization, the following new window will appear with various options and settings.
There are five things for us to notice on this window:
A filter option that allows us to filter the data before creating a graph. In this case our goal is to display successful RDP logons specifically related to service accounts. We can use a filter to only consider event IDs that match 4624 – An account was successfully logged on. In this case though, we should also take into account the logon type which should be RemoteInteractive (winlog.logon.type field). The following images demonstrates how we can specify such filters.


windows* in the "Index pattern".This search bar provides us with the ability to double-check the existence of a specific field within our data set, serving as another way to ensure that we are looking at the correct data. We are interested in the user.name.keyword field. We can use the search bar to quickly perform a search and verify if this field is present and discovered within our selected data set. This allows us to confirm that we are accessing the desired field and working with accurate data.
Lastly, this drop-down menu enables us to select the type of visualization we want to create. The default option displayed in the earlier image is "Bar vertical stacked". If we click on that button, it will reveal additional available options (image redacted as not all options fit on the screen). From this expanded list, we can choose the desired visualization type that best suits our requirements and data presentation needs.
For this visualization, let's select the "Table" option. After selecting the "Table", we can proceed to click on the "Rows" option. This will allow us to choose the specific data elements that we want to include in the table view.
Let's configure the "Rows" settings as follows.
Moving forward, let's close the "Rows" window and proceed to enter the "Metrics" configuration.
In the "Metrics" window, let's select "count" as the desired metric.
One final addition to the table is to include two more "Rows" settings to show the machine where the successful RDP logon attempt occurred and the machine that initiated the successful RDP logon attempt. To do this, we will select the host.hostname.keyword field that represents the computer reporting the successful RDP logon attempt and the related.ip.keyword field that represents the IP of the computer initiating the succsessful RDP logon attempt. This will allow us to display the involved machines alongside the count of successful logon attempts, as shown in the image.


As discussed, we want to monitor successful RDP logons specifically related to service accounts, knowing for a fact that all service accounts of the environment start with svc-. So, to conclude our visualization we need to specify the following KQL query.
SIEM Visualization Example 3: Successful RDP Logon Related To Service Accounts
user.name: svc-*
Note: As you can see we don't use the .keyword field in KQL queries.

Now we can see four columns in the table, which contain the following information:
Finally, click on "Save and return", and you will observe that the new visualization is added to the dashboard.
In this SIEM visualization example, we aim to create a visualization to monitor user additions or removals from the local "Administrators" group from March 5th 2023 to date.
Our visualization will be based on the following Windows event logs.
Navigate to the bottom of this section and click on Click here to spawn the target system!.
Navigate to http://[Target IP]:5601, click on the side navigation toggle, and click on "Dashboard".
A prebaked dashboard should be visible. Let's click on the "pencil"/edit icon.
Now, to initiate the creation of our first visualization, we simply have to click on the "Create visualization" button.
Upon initiating the creation of our first visualization, the following new window will appear with various options and settings.
There are five things for us to notice on this window:
A filter option that allows us to filter the data before creating a graph. In this case our goal is to display user additions or removals from the local "Administrators" group. We can use a filter to only consider event IDs that match 4732 – A member was added to a security-enabled local group and 4733 – A member was removed from a security-enabled local group. We can also use a filter to only consider 4732 and 4733 events where the local group is the "Administrators" one.

windows* in the "Index pattern".This search bar provides us with the ability to double-check the existence of a specific field within our data set, serving as another way to ensure that we are looking at the correct data. We are interested in the user.name.keyword field. We can use the search bar to quickly perform a search and verify if this field is present and discovered within our selected data set. This allows us to confirm that we are accessing the desired field and working with accurate data.
Lastly, this drop-down menu enables us to select the type of visualization we want to create. The default option displayed in the earlier image is "Bar vertical stacked". If we click on that button, it will reveal additional available options (image redacted as not all options fit on the screen). From this expanded list, we can choose the desired visualization type that best suits our requirements and data presentation needs.
For this visualization, let's select the "Table" option. After selecting the "Table", we can proceed to click on the "Rows" option. This will allow us to choose the specific data elements that we want to include in the table view.
Let's configure the "Rows" settings as follows.
Moving forward, let's close the "Rows" window and proceed to enter the "Metrics" configuration.
In the "Metrics" window, let's select "count" as the desired metric.
One final addition to the table is to include some more "Rows" settings to enhance our understanding.
winlog.event_data.MemberSid.keyword field)group.name.keyword field)event.action.keyword field)On which machine did the action occur? (host.name.keyword field)

Click on "Save and return", and you will observe that the new visualization is added to the dashboard.
As discussed, we want to monitor user additions or removals from the local "Administrators" group within a specific timeframe (March 5th 2023 to date).
We can narrow the scope of our visualization as follows.


Finally, let's click on the "Save" button so that all our edits persist.
Alert triaging, performed by a Security Operations Center (SOC) analyst, is the process of evaluating and prioritizing security alerts generated by various monitoring and detection systems to determine their level of threat and potential impact on an organization's systems and data. It involves systematically reviewing and categorizing alerts to effectively allocate resources and respond to security incidents.
Escalation is an important aspect of alert triaging in a SOC environment. The escalation process typically involves notifying supervisors, incident response teams, or designated individuals within the organization who have the authority to make decisions and coordinate the response effort. The SOC analyst provides detailed information about the alert, including its severity, potential impact, and any relevant findings from the initial investigation. This allows the decision-makers to assess the situation and determine the appropriate course of action, such as involving specialized teams, initiating broader incident response procedures, or engaging external resources if necessary.
Escalation ensures that critical alerts receive prompt attention and facilitates effective coordination among different stakeholders, enabling a timely and efficient response to potential security incidents. It helps to leverage the expertise and decision-making capabilities of individuals who are responsible for managing and mitigating higher-level threats or incidents within the organization.
Initial Alert Review:
Thoroughly review the initial alert, including metadata, timestamp, source IP, destination IP, affected systems, and triggering rule/signature.
Analyze associated logs (network traffic, system, application) to understand the alert's context.
Alert Classification:
Classify the alert based on severity, impact, and urgency using the organization's predefined classification system.
Alert Correlation:
Cross-reference the alert with related alerts, events, or incidents to identify patterns, similarities, or potential indicators of compromise (IOCs).
Leverage threat intelligence feeds to check for known attack patterns or malware signatures.
Enrichment of Alert Data:
Gather additional information to enrich the alert data and gain context:
Risk Assessment:
Evaluate the potential risk and impact to critical assets, data, or infrastructure:
Contextual Analysis:
The analyst considers the context surrounding the alert, including the affected assets, their criticality, and the sensitivity of the data they handle.
The analyst assesses the relevant compliance requirements, industry regulations, and contractual obligations to understand the implications of the alert on the organization's legal and regulatory compliance posture.
Incident Response Planning:
Initiate an incident response plan if the alert is significant:
Consultation with IT Operations:
Assess the need for additional context or missing information by consulting with IT operations or relevant departments:
Response Execution:
Based on the alert review, risk assessment, and consultation, determine the appropriate response actions.
If the alert still indicates potential security concerns or requires further investigation, proceed with the incident response actions.
Escalation:
Identify triggers for escalation based on organization's policies and alert severity:
In some cases, escalate to external entities (law enforcement, incident response providers, CERTs) based on legal/regulatory requirements.
Continuous Monitoring:
Continuously monitor the situation and incident response progress.
Collaborate closely with escalated teams for a coordinated response.
De-escalation:
Evaluate the need for de-escalation as the incident response progresses and the situation is under control.
Regularly review and update the process, aligning it with organizational policies, procedures, and guidelines. Adapt the process to address emerging threats and evolving needs.